Acer 2006 Annual Report Download - page 37
Download and view the complete annual report
Please find page 37 of the 2006 Acer annual report below. You can navigate through the pages in the report by either clicking on the pages listed below, or by using the keyword search tool below to find specific information within the annual report.-
 1
1 -
2
-
3
-
4
-
5
-
6
-
7
-
8
-
9
-
10
-
11
-
12
-
13
-
14
-
15
-
16
-
17
-
18
-
19
-
20
-
21
-
22
-
23
-
24
-
25
-
26
-
 27
27 -
 28
28 -
 29
29 -
 30
30 -
 31
31 -
 32
32 -
 33
33 -
 34
34 -
 35
35 -
 36
36 -
 37
37 -
 38
38 -
 39
39 -
 40
40 -
 41
41 -
 42
42 -
 43
43 -
 44
44 -
 45
45 -
 46
46 -
 47
47 -
48
-
49
 |
 |

-33-
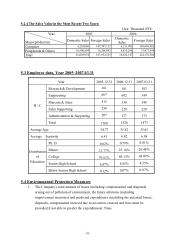
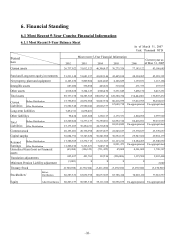
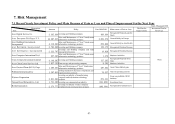
6. Financial Standing
6.1 Most Recent 5-Year Concise Financial Information
6.1.1 Most Recent 5-Year Balance Sheet
As of March 31, 2007
Unit: Thousand NTD
Most recent 5-Year Financial Information
Period
Item 2002 2003 2004 2005 2006
Current year as
of Mar. 31, 2007
Current assets 26,737,022 31,012,523 46,306,417 76,275,326 77,143,122 83,186,685
Fund and Long-term equity investments 51,231,148 51,681,937 43,692,146 42,445,814 48,394,265 45,918,391
N
et property, plant and equipmen
t
6,163,250 5,809,884 4,664,043 4,108,829 1,139,871 1,115,168
Intangible assets 687,080 536,898 465,632 319,106 271,373 257,977
Other assets 4,918,658 5,344,123 4,908,476 5,231,649 7,496,170 6,415,251
Total assets 89,737,158 94,385,365 100,036,714 128,380,724 134,444,801 136,893,472
Before Distribution 15,756,891 22,872,968 38,067,574 60,416,979 57,612,595 56,234,015
Current
Liabilities After Distribution 19,582,548 27,980,042 43,026,737 67,648,718 Un-appropriated Un-appropriated
Long-term liabilities 7,494,311 6,678,481 - - - -
Other liabilities 98,424 1,825,688 1,292,117 2,175,331 2,804,096 2,997,920
Before Distribution 23,349,626 31,377,137 39,359,691 62,592,310 60,416,691 59,231,935
Total
Liabilities After Distribution 27,175,283 36,484,211 44,318,854 69,824,049 Un-appropriated Un-appropriated
Common stock 20,195,081 20,736,998 20,933,677 22,545,187 23,370,637 23,370,637
Capital surplus 36,884,792 33,347,630 30,541,968 30,552,133 29,947,020 29,854,175
Before Distribution 17,386,385 15,372,713 13,211,567 16,123,212 18,284,265 23,946,830
Retained
Earnings After Distribution 11,206,010 9,325,631 7,645,710 8,891,473 Un-appropriated Un-appropriated
Unrealized Gain (loss) on Financial
assets
(69,264) (186,122) (731,425) 65,608 4,361,608 1,726,307
Translation adjustments 695,037 491,763 132,516 (226,806) 1,335,500 2,032,468
Minimum Pension Liability adjustment (3,801) 0 0 0 0
2,040
Treasury Stock (8,700,698) (6,730,384) (3,411,280) (3,270,920) (3,270,920) (3,270,920)
Stockholders’ Before
Distribution 66,387,532 63,032,598 60,677,023 65,788,414 74,028,110 77,661,537
Equity After Distribution 60,207,157 56,985,516 55,111,166 58,556,675 Un-appropriated Un-appropriated