Acer 2006 Annual Report Download - page 24
Download and view the complete annual report
Please find page 24 of the 2006 Acer annual report below. You can navigate through the pages in the report by either clicking on the pages listed below, or by using the keyword search tool below to find specific information within the annual report.
-20-
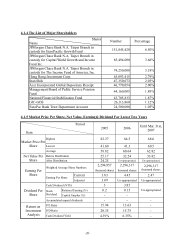
4.1.4 The List of Major Shareholders
Shares
Name Number Percentage
JPMorgan Chase Bank N.A. Taipei Branch in
custody for EuroPacific Growth Fund 151,845,420 6.50%
JPMorgan Chase Bank N.A. Taipei Branch in
custody for Capital World Growth and Income
Fund Inc.
85,494,000 3.66%
JPMorgan Chase Bank N.A. Taipei Branch in
custody for The Income Fund of America, Inc. 74,250,000 3.18%
Hong Rong Investment Corp. 65,093,415 2.79%
Stan Shih 47,350,073 2.03%
Acer Incorporated Global Depositary Receipt 46,770,054 2.00%
Management Board of Public Service Pension
Fund 44,160,005 1.89%
National Financial Stabilization Fund 43,705,833 1.87%
GIC-GOS 26,113,860 1.12%
SinoPac Bank Trust Department Account
24,500,000 1.05%
4.1.5 Market Price Per Share, Net Value, Earning& Dividend For Latest Two Years
Period
Item
2005 2006
Until Mar. 31st,
2007
Highest 82.37 84.5 68.6
Lowest 41.60 41.3 60.5
Market Price Per
Share
Average 58.82 60.64 62.82
Before Distribution 25.17 32.24 33.82
Net Value Per
Share After Distribution 24.25 Un-appropriated Un-appropriated
2,294,957 2,296,317
Weighted Average Share Numbers thousand shares thousand shares
2,296,317
thousand shares
Current 3.83 4.45 2.47
Earning Per
Share Earning Per Share Adjusted 3.69 Un-appropriated Un-appropriated
Cash Dividend (NT$) 3 3.85
Retained Earning (%) 0.2 0.15
Stock
Dividend Capital Surplus (%) - -
Un-appropriated
Dividend Per
Share
Accumulated unpaid dividends - - -
P/E Ratio 15.94 13.63 -
P/D Ratio 20.35 15.75 -
Return on
Investment
Analysis Cash Dividend Yield 4.91% 6.35% -


