Acer 2006 Annual Report Download - page 34
Download and view the complete annual report
Please find page 34 of the 2006 Acer annual report below. You can navigate through the pages in the report by either clicking on the pages listed below, or by using the keyword search tool below to find specific information within the annual report.-
 1
1 -
2
-
3
-
4
-
5
-
6
-
7
-
8
-
9
-
10
-
11
-
12
-
13
-
14
-
15
-
16
-
17
-
18
-
19
-
20
-
21
-
22
-
23
-
 24
24 -
 25
25 -
 26
26 -
 27
27 -
 28
28 -
 29
29 -
 30
30 -
 31
31 -
 32
32 -
 33
33 -
 34
34 -
 35
35 -
 36
36 -
 37
37 -
 38
38 -
 39
39 -
 40
40 -
 41
41 -
 42
42 -
 43
43 -
 44
44 -
45
-
46
-
47
-
48
-
49
 |
 |

-30-
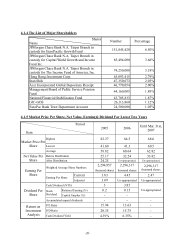
5.2.2. Key Accounts which Account for over 10% of Total Net Sales or Stock in Either
One of the Past Two Years:
(1) Key Buyers (Expressed in Thousand NTD)
Unit: Thousand NT$
Year 2005 Year 2006
ITEM name amount
Percentage
of total net
sales (%)
Relationship
with AI name amount
Percentag
e of total
net sales
(%)
Relationship
with AI
1 AEG 102,556,592 52 (NOTE1) AEG 122,919,107 50
(NOTE1)
2 AAC 32,468,666 18 (NOTE1) AAC 42,364,362 16
(NOTE1)
NOTE1: Subsidiary of the Company.
Central billing to AEG for Europe region since 2005.
AAC (PA region) increased retailer model since 2005.
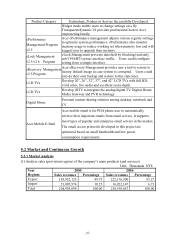
(2) Key Suppliers (Expressed in Thousand NTD)
Unit: Thousand NT$
Year 2005 Year 2006
from amount
Percentage
of total net
sales (%)
Relationship
with AI from amount
Percentage
of total net
sales (%)
Relationship
with AI
1 Supplier A
88,356,319 30 none Supplier a 74,930,987 21 none
2 Supplier B
34,793,087 12 none Supplier b 73,416,724 20 none
3 Supplier C
30,055,207 10 none Supplier c 46,245,728 13 (NOTE1)
Supplier D
28,080,221 10 (NOTE1)
Supplier d 39,049,635 11 none
NOTE1:Investee of the Company valued by the equity method
5.2.3 Production Value in the Most Recent Two Years:
Not Applicable