Acer 2006 Annual Report Download - page 39
Download and view the complete annual report
Please find page 39 of the 2006 Acer annual report below. You can navigate through the pages in the report by either clicking on the pages listed below, or by using the keyword search tool below to find specific information within the annual report.-
 1
1 -
2
-
3
-
4
-
5
-
6
-
7
-
8
-
9
-
10
-
11
-
12
-
13
-
14
-
15
-
16
-
17
-
18
-
19
-
20
-
21
-
22
-
23
-
24
-
25
-
26
-
27
-
28
-
 29
29 -
 30
30 -
 31
31 -
 32
32 -
 33
33 -
 34
34 -
 35
35 -
 36
36 -
 37
37 -
 38
38 -
 39
39 -
 40
40 -
 41
41 -
 42
42 -
 43
43 -
 44
44 -
 45
45 -
 46
46 -
 47
47 -
 48
48 -
 49
49
 |
 |
-35-
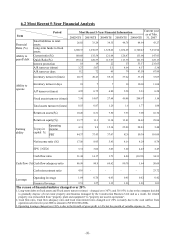
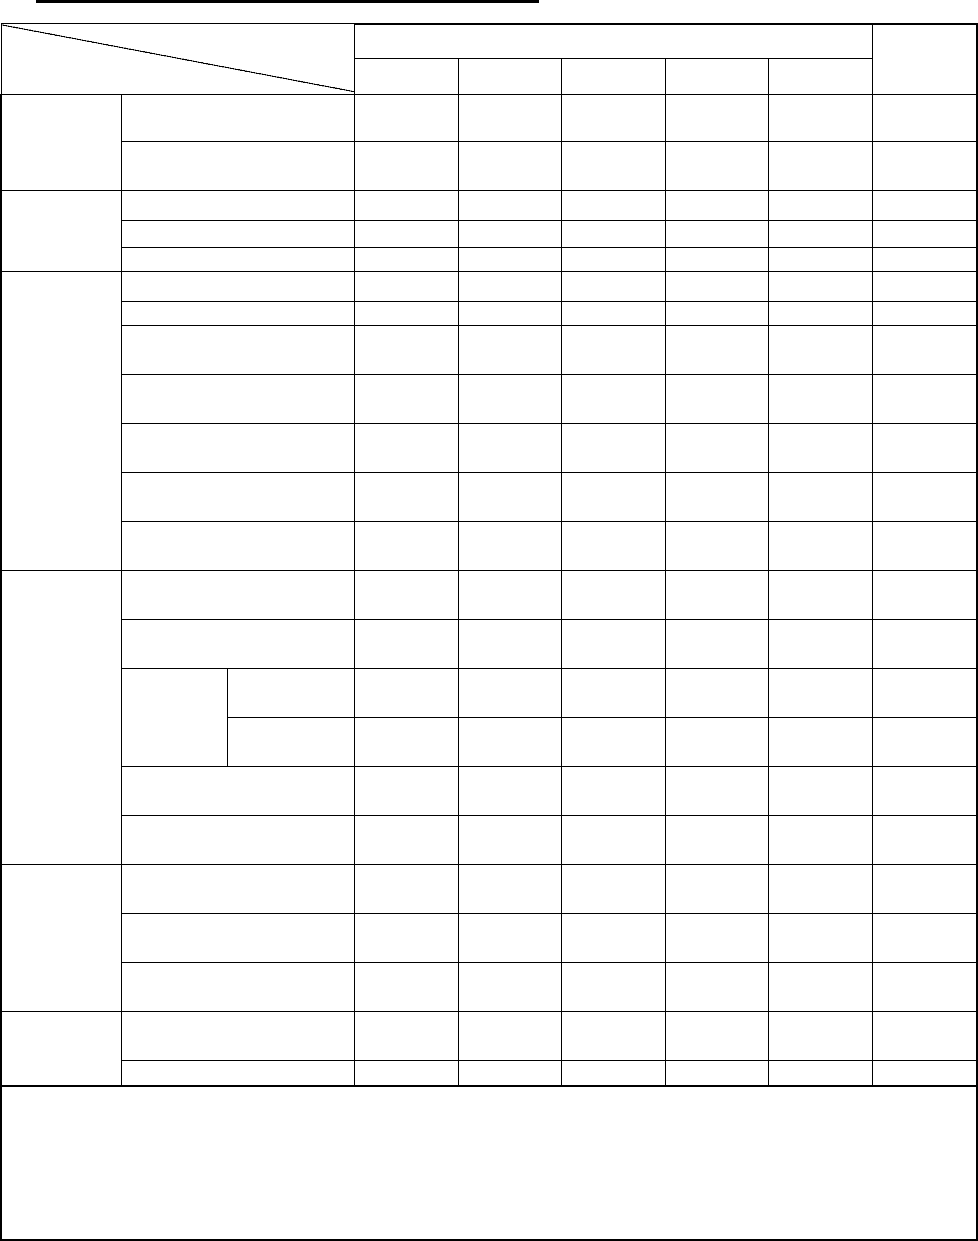
6.2 Most Recent 5-Year Financial Analysis
Most Recent 5-Year Financial Information
Period
Item 2002NT$ 2003NT$ 2004NT$ 2005NT$ 2006NT$
Current year
as of Mar.
31, 2007
Total liabilities to total
assets 26.02 33.24 39.35 48.76 44.94 43.27
Financial
Ratio (%) Long-term funds to fixed
assets 1,200.35 1,230.87 1,328.66 1,654.09 6,740.43 7,232.94
Current ratio(%) 169.68 135.59 121.64 126.47 133.90 147.93
Quick Ratio(%) 155.14 128.37 113.97 113.79 121.39 125.13
Ability to
payoff debt
Interest protection 18 19 22 53 53.37 235.65
A/R turnover (times) 3.27 5.07 5.3 4.94 4.37 5.38
A/R turnover days 112 72 69 74 83.58 67.89
Inventory turnover (times) 20.73 49.43 55.19 37.62 33.29 33.07
Inventory turnover days 18 7 7 10 10.96 11.04
A/P turnover (times) 4.95 6.75 6.80 5.58 5.33 6.28
Fixed assets turnover (times) 7.99 14.07 27.68 49.88 208.97 1.16
Ability to
operate
Total assets turnover (times) 0.55 0.87 1.29 1.6 1.77 1.88
Return on assets(%) 10.26 8.31 7.50 7.55 7.90 16.76
Return on equity(%) 13.77 11.3 11.34 13.41 14.62 29.86
Operating
income 4.31 9.9 15.34 25.89 28.83 2.48
To pay-in
capital % PBT 44.37 37.43 37.07 42.8 50.38 101.09
N
et income ratio (%) 17.56 8.95 5.43 4.14 4.29 8.79
Earning
ability
EPSNTD 3.31 3.02 3.03 3.69 4.45 2.47
Cash flow ratio 31.44 14.17 1.79 4.84 (18.93) 34.31
Cash flow adequacy ratio 86.98 80.9 69.62 80.78 1.64 50.69
Cash flow (%)
Cash reinvestment ratio 4.16 - - - - 23.72
Operating leverage 1.84 0.76 0.63 0.45 0.62 0.42
Leverage
Financial leverage 2.51 1.27 1.13 1.03 1.03 1.01
The reason of financial indictor changed over 20%
1. Long-term debts to fixed assets and Fixed assets turnover (times):changed over 307% and 318.95% is due to the company decided
to gradually dispose of real estate property and business managed by the Construction Business Unit and as a result, the related
property was reclassified from “property, plant and equipment” to “property not used in operations”.
2. Cash flow ratio, Cash flow adequacy ratio and Cash reinvestment ratio changed over 20% is mainly due to the cash outflow from
operation activities for year 2006 is amount to NTD 10,906,202K.
3. Operating leverage changed over 38% is due to the Growth of gross profit is 14% but the growth of variable expense is –7%.