Abercrombie & Fitch 2007 Annual Report Download - page 9
Download and view the complete annual report
Please find page 9 of the 2007 Abercrombie & Fitch annual report below. You can navigate through the pages in the report by either clicking on the pages listed below, or by using the keyword search tool below to find specific information within the annual report.-
 1
1 -
 2
2 -
 3
3 -
 4
4 -
 5
5 -
 6
6 -
 7
7 -
 8
8 -
 9
9 -
 10
10 -
 11
11 -
 12
12 -
 13
13 -
 14
14 -
 15
15 -
 16
16 -
 17
17 -
 18
18 -
 19
19 -
 20
20 -
21
-
22
-
23
-
24
 |
 |

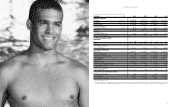
The following measurements are among the key business indicators
reviewed by various members of management to gauge the Company’s
results:
n
Comparable store sales by brand, by product and by store,
defined as year-over-year sales for a store that has been open as
the same brand at least one year and its square footage has not
been expanded or reduced by more than 20% within the past year;
n
Direct-to-consumer sales growth;
n International and flagship store performance;
n New store productivity;
n IMU;
n Selling margin, defined as sales price less original cost, by brand
and by product category;
n Stores and distribution expense as a percentage of net sales;
n Marketing, general and administrative expense as a percentage of
net sales;
n Store metrics such as sales per gross square foot, sales per selling
square foot, average unit retail, average number of transactions
per store, average transaction values, store contribution (defined
as store sales less direct costs of running the store), and average
units per transaction;
n Markdown rate;
n Gross profit rate;
n Operating income and operating income as a percentage of net sales;
n Net income;
n Inventory per gross square foot; and
n Cash flow and liquidity determined by the Company’s current
ratio and cash provided by operations.
While not all of these metrics are disclosed publicly by the Company due to
the proprietary nature of the information, the Company publicly discloses
and discusses several of these metrics as part of its financial summary and in
several sections within the Management’s Discussion and Analysis.
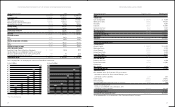
FISCAL 2007 COMPARED TO FISCAL 2006: FOURTH
QUARTER RESULTS: NET SALES Fourth quarter net sales
for the thirteen week period ended February 2, 2008 were $1.229 bil-
lion, up 7.9% versus net sales of $1.139 billion for the fourteen week
period ended February 3, 2007. The net sales increase was attributed
primarily to the net addition of 91 stores and a 46.8% increase in direct-
to-consumer business (including shipping and handling revenue),
partially offset by an extra selling week in the fourth quarter of Fiscal
2006 and the resulting impact of the calendar shift in Fiscal 2007 due
to Fiscal 2006 being a 53-week fiscal year, as well as a 1% decrease in
comparable store sales.
Comparable store sales by brand for the fourth quarter of Fiscal
2007 were as follows: Abercrombie & Fitch increased 1% with men’s
comparable store sales increasing by a low double-digit and women’s
decreasing by a mid single-digit; abercrombie decreased 3% with
boys’ increasing by a mid single-digit and girls’ decreasing by a mid
single-digit; Hollister decreased 2% with dudes’ increasing by a high
single-digit and bettys’ decreasing by a mid single-digit; and RUEHL
decreased 19% with men’s decreasing by a high single-digit and
women’s decreasing by the high twenties.
Comparable regional store sales ranged from increases in the high
teens to decreases in the mid single-digits. Stores located in Canada and
the Southwest and North Atlantic regions had the strongest comparable
store sales performance, while stores located in the South, Midwest
and West regions had the weakest comparable store sales performance
on a consolidated basis.
From a merchandise classification standpoint across all brands, stronger
performing masculine categories included graphic tees, fragrance and
fleece, while pants, jeans and knits posted negative comparable sales. In
the feminine businesses, across all brands, stronger performing categories
included graphics tees, jeans and sweaters, while knits and fleece
posted negative comparable sales.
Direct-to-consumer net merchandise sales, which are sold through
the Company’s websites and catalogue in the fourth quarter of Fiscal
2007, were $108.6 million, an increase of 45.2% versus last year’s
fourth quarter net merchandise sales of $74.8 million. Shipping and
handling revenue for the corresponding periods was $15.6 million in
Fiscal 2007 and $9.8 million in Fiscal 2006. The direct-to-consumer
business, including shipping and handling revenue, accounted for
10.1% of total net sales in the fourth quarter of Fiscal 2007 compared
to 7.4% in the fourth quarter of Fiscal 2006. The increase was driven
by store expansion, both domestically and internationally, improved
in-stock inventory availability, an improved targeted e-mail marketing
strategy and improved website functionality.
GROSS PROFIT Gross profit during the fourth quarter of Fiscal
2007 was $825.6 million compared to $755.6 million for the comparable
period in Fiscal 2006. The gross profit rate (gross profit divided by net
sales) for the fourth quarter of Fiscal 2007 was 67.2%, up 80 basis points
from last year’s fourth quarter rate of 66.4%. The increase in gross
profit rate can be attributed to both a higher IMU rate and a lower
shrink rate compared to the fourth quarter of Fiscal 2006, partially offset
by a higher markdown rate.
STORES AND DISTRIBUTION EXPENSE Stores and distribution
expense for the fourth quarter of Fiscal 2007 was $388.4 million compared
to $349.8 million for the comparable period in Fiscal 2006. The stores and
distribution expense rate (stores and distribution expense divided by net
sales) for the fourth quarter of Fiscal 2007 was 31.6%, up 90 basis points
from 30.7% in the fourth quarter of Fiscal 2006. The increase in rate is
primarily related to the impact of minimum wage and management salary
increases and higher store fixed cost rates.
The DC productivity level, measured in units processed per labor hour
(“UPH”), was 16.1% higher in the fourth quarter of Fiscal 2007 versus the
fourth quarter of Fiscal 2006, reflecting the realization of increased efficiencies
due to the second DC being operational during Fiscal 2007.
MARKETING, GENERAL AND ADMINISTRATIVE EXPENSE
Marketing, general and administrative expense during the fourth
quarter of Fiscal 2007 was $103.2 million compared to $101.6 million
during the same period in Fiscal 2006. For the fourth quarter of
Fiscal 2007, the marketing, general and administrative expense
rate (marketing, general and administrative expense divided by net
sales) was 8.4% compared to 8.9% in the fourth quarter of Fiscal
2006. The decrease in the marketing, general and administrative
expense rate was a result of lower travel, samples and outside ser-
vice expense rates, partially offset by an increase in the home office
payroll expense rate.
OTHER OPERATING INCOME, NET Fourth quarter net other
operating income for Fiscal 2007 was $3.0 million compared to $4.6
million for the fourth quarter of Fiscal 2006. The decrease was driven
primarily by losses on foreign currency transactions in the fourth quarter
of Fiscal 2007 as compared to gains on foreign currency transactions in
the fourth quarter of Fiscal 2006.
OPERATING INCOME Operating income during the fourth
quarter of Fiscal 2007 increased to $337.1 million from $308.8 million
for the comparable period in Fiscal 2006, an increase of 9.2%. The
operating income rate (operating income divided by net sales) for the
fourth quarter of Fiscal 2007 was 27.4% compared to 27.1% for the
fourth quarter of Fiscal 2006.
INTEREST INCOME, NET AND INCOME TAXES Fourth
quarter net interest income was $6.4 million in Fiscal 2007 compared
to $4.7 million during the comparable period in Fiscal 2006. The
increase in net interest income was due to higher interest rates and
higher available investment balances during the fourth quarter of
Fiscal 2007 when compared to the fourth quarter of Fiscal 2006.
The effective tax rate for the fourth quarter of 2007 was 36.9% as
compared to 36.8% for the Fiscal 2006 comparable period.
NET INCOME AND NET INCOME PER SHARE Net income
for the fourth quarter of Fiscal 2007 was $216.8 million versus $198.2
million for the fourth quarter of Fiscal 2006, an increase of 9.4%. Net
income per diluted weighted-average share outstanding for the fourth
quarter of Fiscal 2007 was $2.40, versus $2.14 for the Fiscal 2006 com-
parable period, an increase of 12.2%.
FISCAL 2007 RESULTS: NET SALES Net sales for Fiscal 2007 were
$3.750 billion, an increase of 13.0% versus Fiscal 2006 net sales of $3.318
billion. The net sales increase was attributed to the combination of the net
addition of 91 stores and a 50% increase in direct-to-consumer business
(including shipping and handling revenue), partially offset by a 1% compa-
rable store sales decrease and a fifty-three week year in Fiscal 2006 versus a
fifty-two week year in Fiscal 2007.
For Fiscal 2007, comparable store sales by brand were as follows:
Abercrombie & Fitch and abercrombie comparable sales were flat; Hollister
decreased 2%; and RUEHL decreased 9%. In addition, the women’s, girls’
and bettys’ businesses continued to be more significant than the men’s, boys’
and dudes’. During Fiscal 2007, women’s, girls and bettys represented at
least 60% of the net sales for each of their corresponding brands.
Direct-to-consumer merchandise net sales in Fiscal 2007 were $258.9
million, an increase of 49% versus Fiscal 2006 net merchandise sales of
$174.1 million. Shipping and handling revenue was $39.1 million in
Fiscal 2007 and $24.9 million in Fiscal 2006. The direct-to-consumer
business, including shipping and handling revenue, accounted for
8.0% of total net sales in Fiscal 2007 compared to 6.0% of total net
sales in Fiscal 2006. The increase was driven by store expansion, both
domestically and internationally, improved in-stock inventory avail-
ability, an improved targeted e-mail marketing strategy and improved
website functionality.
GROSS PROFIT For Fiscal 2007, gross profit increased to $2.511
billion from $2.209 billion in Fiscal 2006. The gross profit rate for
Fiscal 2007 was 67.0% versus 66.6% the previous year, an increase of 40
basis points. The increase in the gross profit rate was driven primarily
by a higher IMU rate and a lower shrink rate in the fourth quarter of
Fiscal 2007, partially offset by a higher markdown rate.
STORES AND DISTRIBUTION EXPENSE Stores and distribution
expense for Fiscal 2007 was $1.387 billion compared to $1.187 billion
for Fiscal 2006. For Fiscal 2007, the stores and distribution expense rate
was 37.0% compared to 35.8% in the previous year. The increase in
rate resulted primarily from store payroll, including minimum wage
and store manager salary increases, higher store fixed cost rates and
store packaging and supply expenses.
The DCs’ UPH rate for Fiscal 2007 increased 9.1% as compared to
Fiscal 2006, reflecting the realization of efficiencies obtained during
Fiscal 2007 due to the second DC being operational. The Company
expects the overall UPH level to continue to improve during Fiscal
2008, however at a lower rate than Fiscal 2007.
MARKETING, GENERAL AND ADMINISTRATIVE EXPENSE
Marketing, general and administrative expense during Fiscal 2007
was $395.8 million compared to $373.8 million in Fiscal 2006. For the
current year, the marketing, general and administrative expense rate
was 10.6%, a decrease of 70 basis points compared to last year’s rate
of 11.3%. The decrease in rate resulted from reductions in travel, sam-
ples and outside services expense rates, partially offset by the increase
in payroll expense rate.
OTHER OPERATING INCOME, NET Other operating income
for Fiscal 2007 was $11.7 million compared to $10.0 million for Fiscal 2006.
The increase was primarily related to gift cards for which the Company
has determined the likelihood of redemption to be remote, partially
offset by decreases in gains related to foreign currency transactions. The
comparable year-to-date period in Fiscal 2006 included other operating
income related to insurance reimbursements for a fire-damaged store
and a store damaged by Hurricane Katrina.
OPERATING INCOME Fiscal 2007 operating income was $740.5
million compared to $658.1 million for Fiscal 2006, an increase of 12.5%.
The operating income rate for Fiscal 2007 was 19.7% versus 19.8% in the
previous year.
INTEREST INCOME, NET AND INCOME TAXES Net interest
income for Fiscal 2007 was $18.8 million compared to $13.9 million
for Fiscal 2006. The increase in net interest income was due to higher
interest rates and higher available investment balances during Fiscal
2007 compared to Fiscal 2006.
The effective tax rate for Fiscal 2007 was 37.4% compared to 37.2%
for Fiscal 2006.
NET INCOME AND NET INCOME PER SHARE Net income
for Fiscal 2007 was $475.7 million versus $422.2 million in Fiscal 2006, an
increase of 12.7%. Net income per diluted weighted-average share was
$5.20 in Fiscal 2007 versus $4.59 in Fiscal 2006, an increase of 13.3%.
FISCAL 2006 COMPARED TO FISCAL 2005: FOURTH
QUARTER RESULTS: NET SALES Net sales for the fourth
quarter of Fiscal 2006 were $1.139 billion, up 18.5% versus net sales of
$961.4 million in the fourth quarter of Fiscal 2005. The net sales increase
was attributed primarily to the net addition of 93 stores, including the
full quarter impact of the Abercrombie & Fitch Fifth Avenue flagship
and six stores in Canada; a 58% increase in direct-to-consumer business
(including shipping and handling revenue); and a fourteen week quarter
in Fiscal 2006 versus a thirteen week quarter in Fiscal 2005, partially
14 15