Abercrombie & Fitch 2007 Annual Report Download - page 10
Download and view the complete annual report
Please find page 10 of the 2007 Abercrombie & Fitch annual report below. You can navigate through the pages in the report by either clicking on the pages listed below, or by using the keyword search tool below to find specific information within the annual report.-
 1
1 -
 2
2 -
 3
3 -
 4
4 -
 5
5 -
 6
6 -
 7
7 -
 8
8 -
 9
9 -
 10
10 -
 11
11 -
 12
12 -
 13
13 -
 14
14 -
 15
15 -
 16
16 -
 17
17 -
 18
18 -
 19
19 -
 20
20 -
 21
21 -
22
-
23
-
24
 |
 |

offset by a 3% decrease in comparable store sales.
Comparable store sales by brand for the fourth quarter of Fiscal
2006 versus the fourth quarter of Fiscal 2005 were as follows:
Abercrombie & Fitch decreased 6% with women’s comparable store
sales decreasing by a high single-digit and men’s decreasing by a mid
single-digit; abercrombie increased 2% with boys’ achieving a mid
single-digit increase and girls’ flat; Hollister was flat with bettys’ flat
and dudes’ posting a decrease in the low single-digits; and RUEHL
increased 6% with women’s realizing a mid single-digit increase and
men’s posting a low single-digit increase.
On a regional basis, comparable store sales for the Company ranged
from decreases in the high single-digits to increases in the low single-digits.
Stores located in the North Atlantic region had the strongest comparable
store sales performance and stores located in the West region had the
weakest comparable store sales performance on a consolidated basis.
From a merchandise classification standpoint across all brands,
stronger performing masculine categories included fleece, knit tops
and underwear, while jeans, pants and sweaters posted negative
comparable store sales. In the feminine businesses, across all brands,
stronger performing categories included knit tops, fleece and shorts,
while jeans, skirts and pants posted negative comparable store sales.
Direct-to-consumer net merchandise sales, sold through the
Company’s websites and catalogue, in the fourth quarter of Fiscal
2006 were $74.8 million, an increase of 57.5% versus net merchandise
sales of $47.5 million in the fourth quarter of Fiscal 2005. Shipping
and handling revenue for the corresponding periods was $9.8 million
in Fiscal 2006 and $6.2 million in Fiscal 2005. The direct-to-consumer
business, including shipping and handling revenue, accounted for
7.4% of total net sales in the fourth quarter of Fiscal 2006 compared to
5.6% in the fourth quarter of Fiscal 2005.
GROSS PROFIT Gross profit during the fourth quarter of Fiscal
2006 was $755.6 million compared to $639.4 million for the comparable
period in Fiscal 2005. The gross profit rate for the fourth quarter of
Fiscal 2006 was 66.4%, down 10 basis points from the Fiscal 2005
fourth quarter rate of 66.5%. The decrease in gross profit rate largely
resulted from a higher shrink rate and a slightly higher markdown
rate compared to the fourth quarter of Fiscal 2005. Abercrombie &
Fitch, abercrombie and Hollister all operated at similar IMU levels.
STORES AND DISTRIBUTION EXPENSE Stores and distribution
expense for the fourth quarter of Fiscal 2006 was $349.8 million compared
to $293.5 million for the comparable period in Fiscal 2005. The stores and
distribution expense rate for the fourth quarter of Fiscal 2006 was 30.7%, up
20 basis points from 30.5% in the fourth quarter of Fiscal 2005. The increase
in rate is primarily related to additional DC expenses associated with the
second DC, which became fully operational in the fourth quarter, and
direct-to-consumer expenses, which increased due to higher internet sales
as a percentage of total sales. These increases were partially offset by
decreased store expenses as a percentage of sales. Selling payroll, driven by
management salary increases, state minimum wage increases and additional
floor coverage to address shrink concerns increased as a percentage of sales.
However, the increase in selling payroll was more than offset by leveraging
other store related controllable expenses.
The DC productivity level, measured in UPH, was 9% higher in
the fourth quarter of Fiscal 2006 versus the fourth quarter of Fiscal
2005. The UPH rate increase was due to the second DC becoming
fully operational during the fourth quarter.
MARKETING, GENERAL AND ADMINISTRATIVE EXPENSE
Marketing, general and administrative expense during the fourth
quarter of Fiscal 2006 was $101.6 million compared to $80.8 million
during the fourth quarter of Fiscal 2005. For the fourth quarter of
Fiscal 2006, the marketing, general and administrative expense rate
was 8.9% compared to 8.4% in the fourth quarter of Fiscal 2005. The
increase in the marketing, general and administrative expense rate
was due to higher home office payroll and consulting expenses.
OTHER OPERATING INCOME, NET Fourth quarter net
other operating income for Fiscal 2006 was $4.6 million compared to
$2.3 million for the fourth quarter of Fiscal 2005. Other operating
income related primarily to gift cards for which the Company has
determined the likelihood of redemption to be remote.
OPERATING INCOME Operating income during the fourth
quarter of Fiscal 2006 increased to $308.8 million from $267.5 million
in the fourth quarter of Fiscal 2005, an increase of 15.4%. The operating
income rate for the fourth quarter of Fiscal 2006 was 27.1% compared
to 27.8% for the fourth quarter of Fiscal 2005.
INTEREST INCOME, NET AND INCOME TAXES Fourth
quarter net interest income was $4.7 million in Fiscal 2006 compared
to $2.4 million during the comparable period in Fiscal 2005. The
increase in net interest income was due to higher interest rates and
higher available investment balances during the fourth quarter of
Fiscal 2006 when compared to the fourth quarter of Fiscal 2005.
The effective tax rate for the fourth quarter of Fiscal 2006 was
36.8% as compared to 39.0% for the Fiscal 2005 comparable period.
The decrease in the effective tax rate was related primarily to favorable
settlements of tax audits during the fourth quarter and the change in
estimates of potential outcomes of certain state tax matters.
NET INCOME AND NET INCOME PER SHARE Net income
for the fourth quarter of Fiscal 2006 was $198.2 million versus
$164.6 million for the fourth quarter of Fiscal 2005, an increase of
20.4%. Net income per diluted weighted-average share outstanding
for the fourth quarter of Fiscal 2006 was $2.14, including $0.01
related to Statement of Financial Accounting Standards (“SFAS”)
No. 123 (Revised 2004), “Share-Based Payment” (“SFAS 123(R)”),
versus $1.80 for the comparable period in Fiscal 2005, an increase
of 18.9%.
FISCAL 2006 RESULTS: NET SALES Net sales for Fiscal 2006 were
$3.318 billion, an increase of 19.1% versus Fiscal 2005 net sales of $2.785
billion. The net sales increase was attributed to the combination of the
net addition of 93 stores, including the full year impact of the Abercrombie
& Fitch Fifth Avenue flagship and six stores in Canada; a 2% comparable
store sales increase; a 42% increase in direct-to-consumer business (includ-
ing shipping and handling revenue); and a fifty-three week year in Fiscal
2006 versus a fifty-two week year in Fiscal 2005.
For Fiscal 2006, comparable store sales by brand were as follows:
Abercrombie & Fitch decreased 4%; abercrombie increased 10%;
Hollister increased 5%; and RUEHL increased 14%. In addition, the
women’s, girls’ and bettys’ businesses continued to be more significant
than the men’s, boys’ and dudes’.
Direct-to-consumer merchandise net sales in Fiscal 2006 were
$174.1 million, an increase of 42.1% versus Fiscal 2005 net merchan-
dise sales of $122.5 million. Shipping and handling revenue was $24.9
million in Fiscal 2006 and $17.6 million in Fiscal 2005. The direct-
to-consumer business, including shipping and handling revenue,
accounted for 6.0% of total net sales in Fiscal 2006 compared to 5.0%
of net total sales in Fiscal 2005.
GROSS PROFIT For Fiscal 2006, gross profit increased to $2.209 billion
from $1.851 billion in Fiscal 2005. The gross profit rate for Fiscal 2006 was
66.6% versus 66.5% for Fiscal 2005, an increase of 10 basis points.
STORES AND DISTRIBUTION EXPENSE Stores and distribution
expense for Fiscal 2006 was $1.187 billion compared to $1.001 billion for
Fiscal 2005. For Fiscal 2006, the stores and distribution expense rate
was 35.8% compared to 35.9% in Fiscal 2005. The decrease in the rate
resulted primarily from the Company’s ability to leverage store-related
costs on a 2% increase in comparable store sales.
The DC’s UPH rate for the year was flat in Fiscal 2006 versus
Fiscal 2005. During Fiscal 2006, while the second DC was being
built, the overall DC’s UPH was impacted by the Company’s first DC
reaching near capacity, a result of the Company’s focus on strategically
flowing inventory to stores during Fiscal 2006.
MARKETING, GENERAL AND ADMINISTRATIVE EXPENSE
Marketing, general and administrative expense during Fiscal 2006
was $373.8 million compared to $313.5 million in Fiscal 2005. For
Fiscal 2006, the marketing, general and administrative expense rate
was 11.3%, which was flat compared to Fiscal 2005. Fiscal 2006
included a charge of $13.6 million related to the adoption of SFAS
123(R). Fiscal 2005 included a non-recurring charge of $13.5 million
related to a severance agreement with an executive officer.
OTHER OPERATING INCOME, NET Other operating income
for Fiscal 2006 was $10.0 million compared to $5.5 million for Fiscal 2005.
The increase was related to gift cards for which the Company has determined
the likelihood of redemption to be remote and insurance reimbursements
received during the first and second quarters of Fiscal 2006 related to
stores damaged by fire and Hurricane Katrina, respectively.
OPERATING INCOME Fiscal 2006 operating income was $658.1
million compared to $542.7 million for Fiscal 2005, an increase of
21.3%. The operating income rate for Fiscal 2006 was 19.8% versus
19.5% in Fiscal 2005.
INTEREST INCOME, NET AND INCOME TAXES Net interest
income for Fiscal 2006 was $13.9 million compared to $6.7 million for
Fiscal 2005. The increase in net interest income was due to higher
interest rates and higher available investment balances during Fiscal
2006 compared to Fiscal 2005.
The effective tax rate for Fiscal 2006 was 37.2% compared to 39.2%
for Fiscal 2005. The decrease in the effective tax rate primarily related
to favorable settlements of tax audits, favorable changes in estimates of
potential outcomes of certain state tax matters and an increase in tax
exempt income during Fiscal 2006. Fiscal 2005 tax expense reflected
a charge related to the Company’s change in estimate of the potential
outcome of certain state tax matters.
NET INCOME AND NET INCOME PER SHARE Net income
for Fiscal 2006 was $422.2 million versus $334.0 million in Fiscal
2005, an increase of 26.4%. Net income included after-tax charges of
$9.9 million in Fiscal 2006 related to the adoption of SFAS 123(R),
and non-recurring charges of $8.2 million in Fiscal 2005 related to a
severance agreement with an executive officer. Net income per
diluted weighted-average share was $4.59 in Fiscal 2006 versus $3.66
in Fiscal 2005, an increase of 25.4%.
FINANCIAL CONDITION Continued growth in net income
and decreases in inventory resulted in increased cash provided by
operating activities. A more detailed discussion of liquidity, capital
resources and capital requirements follows.
LIQUIDITY AND CAPITAL RESOURCES The Company
expects that substantially all future operations, including projected
growth, seasonal requirements and capital expenditures will be funded
with cash from operations. In addition, the Company has $250 million
available, less outstanding letters of credit, under its unsecured credit
agreement to support operations. Furthermore, the Company expects
that cash from operating activities will fund dividends currently being
paid at a rate of $0.175 per share per quarter. The Board of Directors of
A&F will review the Company’s cash position and results of operations
and address the appropriateness of future dividend amounts.
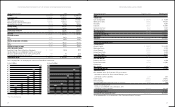
A summary of the Company’s working capital (current assets less
current liabilities) position and capitalization at the end of the last
three fiscal years follows (thousands):
2007 2006 2005
Working capital $ 597,142 $ 581,451 $455,530
Capitalization:
Shareholders’ equity $1,618,313 $1,405,297 $995,117
The increase in working capital during Fiscal 2007 versus Fiscal
2006 was the result of higher cash and marketable securities, resulting
primarily from the Company’s increases in earnings, partially offset
by capital expenditures for expansion, share repurchases and dividends
paid. The increase in working capital in Fiscal 2006 versus Fiscal
2005 was the result of higher cash and marketable securities, resulting
primarily from the increase in the Company’s net income and
decreases in income taxes payable, partially offset by an increase in
accrued expenses. Additionally, the Company did not make any share
repurchases in Fiscal 2006 compared to $103.3 million of repurchases
made in Fiscal 2005.
The Company considers the following to be measures of its liquidity
and capital resources for the last three fiscal years:
2007 2006 2005
Current ratio
(current assets divided by current liabilities) 2.10 2.14 1.93
Net cash provided by
operating activities (in thousands) $817,825 $582,171* $453,590
*Fiscal 2006 was a fifty-three week year.
OPERATING ACTIVITIES Net cash provided by operating activities,
the Company’s primary source of liquidity, increased to $817.8 million for
Fiscal 2007 from $582.2 million in Fiscal 2006. In Fiscal 2007, cash was
provided primarily by current year net income, adjusted for non-cash items
including depreciation and amortization, share-based compensation charges
16 17