Abercrombie & Fitch 2007 Annual Report Download - page 14
Download and view the complete annual report
Please find page 14 of the 2007 Abercrombie & Fitch annual report below. You can navigate through the pages in the report by either clicking on the pages listed below, or by using the keyword search tool below to find specific information within the annual report.-
 1
1 -
2
-
3
-
 4
4 -
 5
5 -
 6
6 -
 7
7 -
 8
8 -
 9
9 -
 10
10 -
 11
11 -
 12
12 -
 13
13 -
 14
14 -
 15
15 -
 16
16 -
 17
17 -
 18
18 -
 19
19 -
 20
20 -
 21
21 -
 22
22 -
 23
23 -
 24
24
 |
 |

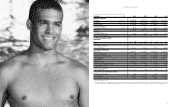
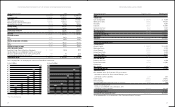
CONSOLIDATED BALANCE SHEETS
(Thousands, except share amounts) February 2, 2008 February 3, 2007
ASSETS
CURRENT ASSETS
Cash and Equivalents $ 118,044 $ 81,959
Marketable Securities 530,486 447,793
Receivables 53,801 43,240
Inventories 333,153 427,447
Deferred Income Taxes 36,128 33,170
Other Current Assets 68,643 58,469
TOTAL CURRENT ASSETS 1,140,255 1,092,078
PROPERTY AND EQUIPMENT, NET 1,318,291 1,092,282
OTHER ASSETS 109,052 63,707
TOTAL ASSETS $ 2,567,598 $ 2,248,067
LIABILITIES AND SHAREHOLDERS’ EQUITY
CURRENT LIABILITIES
Accounts Payable $ 0 108,437 $ 100,919
Outstanding Checks 43,361 27,391
Accrued Expenses 280,910 260,219
Deferred Lease Credits 37,925 35,423
Income Taxes Payable 72,480 86,675
TOTAL CURRENT LIABILITIES 543,113 510,627
LONG-TERM LIABILITIES
Deferred Income Taxes 0 22,491 30,394
Deferred Lease Credits 213,739 203,943
Commitments – –
Other Liabilities 169,942 97,806
TOTAL LONG-TERM LIABILITIES 406,172 332,143
SHAREHOLDERS’ EQUITY
Class A Common Stock – $0.01 par value: 150,000,000 shares
authorized and 103,300,000 shares issued at February 2, 2008
and February 3, 2007, respectively 0 1,033 1,033
Paid-In Capital 319,451 289,732
Retained Earnings 2,051,463 1,646,290
Accumulated Other Comprehensive Income (Loss), net of tax 7,118 (994)
Treasury Stock, at Average Cost
17,141,116 and 14,999,945 shares at February 2, 2008
and February 3, 2007, respectively (760,752) (530,764)
TOTAL SHAREHOLDERS’ EQUITY 1,618,313 1,405,297
TOTAL LIABILITIES AND SHAREHOLDERS’ EQUITY $ 2,567,598 $2,248,067
The accompanying Notes are an integral part of these Consolidated Financial Statements.
CONSOLIDATED STATEMENTS OF NET INCOME AND COMPREHENSIVE INCOME
2007
$3,749,847
1,238,480
2,511,367
1,386,846
395,758
(11,734)
740,497
(18,828)
759,325
283,628
$ 475,697
$5.45
$5.20
87,248
91,523
$0.70
$ 7,328
784
$ 8,112
$ 483,809
2006*
$3,318,158
1,109,152
2,209,006
1,187,071
373,828
(9,983)
658,090
(13,896)
671,986
249,800
$ 422,186
$4.79
$4.59
88,052
92,010
$0.70
($239)
41
($198)
$ 421,988
2005
$2,784,711
933,295
1,851,416
1,000,755
313,457
(5,534)
542,738
(6,674)
549,412
215,426
$ 333,986
$3.83
$3.66
87,161
91,221
$0.60
($78)
(718)
($796)
$ 333,190
(Thousands, except per share amounts)
NET SALES
Cost of Goods Sold
GROSS PROFIT
Stores and Distribution Expense
Marketing, General & Administrative Expense
Other Operating Income, Net
OPERATING INCOME
Interest Income, Net
INCOME BEFORE INCOME TAXES
Provision for Income Taxes
NET INCOME
NET INCOME PER SHARE:
Basic
Diluted
WEIGHTED-AVERAGE SHARES OUTSTANDING:
Basic
Diluted
DIVIDENDS DECLARED PER SHARE
OTHER COMPREHENSIVE INCOME
Cumulative Foreign Currency Translation Adjustments
Unrealized Gains (Losses) on Marketable Securities, net of taxes of
($502), $20 and $0 for Fiscal 2007, Fiscal 2006, and Fiscal 2005,
respectively Other Comprehensive Income (Loss)
COMPREHENSIVE INCOME
The accompanying Notes are an integral part of these Consolidated Financial Statements.
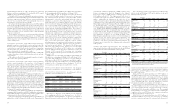
2003 2004 2005 2006* 2007
$110
$130
$150
$170
$190
$210
$230
$250
$270
$290
$310
$330
$350
$370
$390
$410
$430
$450
$470
$205
$216
$334
$422
$476
2003 2004 2005 2006* 2007
$1,200
$1,400
$1,600
$1,800
$2,000
$2,200
$2400
$2,800
$3,000
$3,200
$1,708
$2,785
$3,400
$3,600
$3,800
Net Sales ($ in Millions)
$2,600
$2,021
$3,750
* Fiscal 2006 was a fifty-three week year.
2524
$3,318
Net Income ($ in Millions)
$490