Abercrombie & Fitch 2007 Annual Report Download - page 18
Download and view the complete annual report
Please find page 18 of the 2007 Abercrombie & Fitch annual report below. You can navigate through the pages in the report by either clicking on the pages listed below, or by using the keyword search tool below to find specific information within the annual report.-
 1
1 -
2
-
3
-
4
-
5
-
6
-
7
-
 8
8 -
 9
9 -
 10
10 -
 11
11 -
 12
12 -
 13
13 -
 14
14 -
 15
15 -
 16
16 -
 17
17 -
 18
18 -
 19
19 -
 20
20 -
 21
21 -
 22
22 -
 23
23 -
 24
24
 |
 |

33
if there is a change of control as defined in the plans.
FAIR VALUE ESTIMATES The Company estimates the fair value
of stock options granted using the Black-Scholes option-pricing model,
which requires the Company to estimate the expected term of the stock
option grants and expected future stock price volatility over the expected
term. Estimates of the expected term, which represents the expected
period of time the Company believes the stock options will be outstand-
ing, are based on historical experience. Estimates of expected future
stock price volatility are based on the volatility of A&F’s Common Stock
price for the most recent historical period equal to the expected term of
the stock option. The Company calculates the volatility as the annual-
ized standard deviation of the differences in the natural logarithms of the
weekly stock closing price, adjusted for stock splits and dividends.
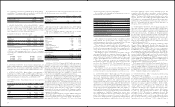
The weighted-average estimated fair values of stock options granted
during the fifty-two week period ended February 2, 2008, the fifty-three
week period ended February 3, 2007 and the fifty-two week period
ended January 28, 2006, as well as the weighted-average assumptions
used in calculating such values, on the date of grant, were as follows:
Fifty-Two Fifty-Three Fifty-Two
Weeks Ended Weeks Ended Weeks Ended
February 2, 2008 February 3, 2007 January 28, 2006
Executive Executive
Officers and Executive Other Officers and
Other Associates Officers Associates Other Associates
Exercise price $74.05 $58.22 $58.12 $60.10
Fair Value $22.56 $24.92 $20.69 $23.01
Assumptions:
Price volatility 34% 47% 42% 47%
Expected term (Years) 4 5 4 4
Risk-free interest rate 4.5% 4.9% 4.9% 4.0%
Dividend yield 1.0% 1.2% 1.2% 1.1%
In the case of restricted stock units, the Company calculates the fair value
of the restricted stock units granted as the market price of the underlying
Common Stock on the date of grant, adjusted for expected dividend pay-
ments during the vesting period.
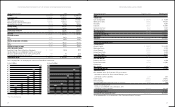
STOCK OPTION ACTIVITY Below is the summary of stock
option activity for Fiscal 2007:
Fifty-Two Weeks Ended February 2, 2008
Number Weighted- Aggregate Weighted-Average
Stock of Average Intristic Remaining
Options Shares Exercise Price Value Contractual Life
Outstanding at
February 3, 2007 8,804,724 $38.07
Granted 341,750 74.05
Exercised (1,323,937) 29.27
Forfeited or expired (84,425) 60.78
Outstanding at
February 2, 2008 7,738,112 $41.03 $284,082,728 2.9
Stock options expected to
vest at February 2, 2008 585,670 $66.11 $ 6,814,891 8.4
Stock options exercisable
at February 2, 2008 7,018,762 $38.61 $274,659,247 2.4
The total intrinsic value of stock options exercised during the
fifty-two weeks ended February 2, 2008, the fifty-three weeks ended
February 3, 2007, and the fifty-two weeks ended January 28, 2006 was
$64.2 million, $15.2 million and $139.9 million, respectively.
The total fair value of stock options vested during the fifty-two
weeks ended February 2, 2008, the fifty-three weeks ended February
3, 2007 and the fifty-two weeks ended January 28, 2006 was $5.1 mil-
lion, $29.5 million and $31.4 million, respectively.
As of February 2, 2008, there was $11.9 million of total unrecog-
nized compensation cost, net of estimated forfeitures, related to stock
options. The unrecognized cost is expected to be recognized over a
weighted-average period of 1.3 years.
RESTRICTED STOCK UNIT ACTIVITY A summary of the
status of the Company’s restricted stock units as of February 2, 2008
and changes during the fifty-two week period ended February 2, 2008
were as follows:
Weighted-Average
Restricted Number of Grant Date
Stock Units Shares Fair Value
Non-vested at February 3, 2007 2,043,456 $40.65
Granted 741,000 $72.69
Vested (284,200) $49.99
Forfeited (145,385) $60.44
Non-vested at February 2, 2008 2,354,871 $48.02
The total fair value of restricted stock units granted during the
fifty-two weeks ended February 2, 2008, the fifty-three weeks ended
February 3, 2007 and the fifty-two weeks ended January 28, 2006 was
$53.9 million, $35.5 million and $36.3 million, respectively.
The total fair value of restricted stock units vested during the fifty-two
weeks ended February 2, 2008, the fifty-three weeks ended February
3, 2007 and the fifty-two weeks ended January 28, 2006 was $14.2 million,
$8.6 million and $5.0 million, respectively.
As of February 2, 2008, there was $65.1 million of total unrecognized
compensation cost, net of estimated forfeitures, related to non-vested
restricted stock units. The unrecognized cost is expected to be recognized
over a weighted-average period of 1.4 years.
5. PROPERTY AND EQUIPMENT Property and equipment, at
cost, consisted of (thousands):
2007 2006
Land $ 32,302 $ 32,291
Building 193,344 181,111
Furniture, fixtures and equipment 540,114 520,391
Information technology 81,110 48,173
Leasehold improvements 977,947 754,224
Construction in progress 177,887 122,695
Other 51,571 10,168
Total $2,054,275 $ 1,669,053
Less: Accumulated depreciation and amortization (735,984) (576,771)
Property and equipment, net $1,318,291 $ 1,092,282
6. DEFERRED LEASE CREDITS, NET Deferred lease credits
are derived from payments received from landlords to partially offset
32
certain other assets and liabilities at fair value on an instrument by
instrument basis. SFAS 159 also establishes presentation and disclo-
sure requirements to facilitate comparisons between companies that
select different measurement attributes for similar types of assets and
liabilities. SFAS 159 was effective for the Company on February 3,
2008. The Company is currently evaluating the potential impact on
the consolidated financial statements of adopting SFAS 159.
4. SHARE-BASED COMPENSATION
BACKGROUND On January 29, 2006, the Company adopted
SFAS No. 123 (Revised 2004), “Share-Based Payment” (“SFAS No.
123(R)”), which requires share-based compensation to be measured
based on estimated fair values at the date of grant using an option-
pricing model. Previously, the Company accounted for share-based
compensation using the intrinsic value method in accordance with
APB Opinion No. 25, “Accounting for Stock Issued to Employees,”
and related interpretations, for which no expense was recognized for
stock options if the exercise price was equal to the market value of the
underlying common stock on the date of grant, and if the Company
provided the required pro forma disclosures in accordance with SFAS
No. 123, “Accounting for Stock-Based Compensation” (“SFAS No.
123”), as amended.
The Company adopted SFAS No. 123(R) using the modified
prospective transition method, which requires share-based compen-
sation to be recognized for all unvested share-based awards begin-
ning in the first quarter of adoption. Accordingly, prior period
information presented in these financial statements has not been
restated to reflect the fair value method of expensing stock options.
Under the modified prospective method, compensation expense
includes a) all share-based awards granted prior to, but not yet vested
as of, January 29, 2006, based on the grant-date fair value estimated
in accordance with the original provisions of SFAS No. 123 and b)
all share-based awards granted subsequent to January 29, 2006,
based on the grant-date fair value estimated in accordance with the
provisions of SFAS No. 123(R).
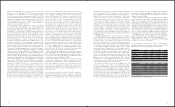
FINANCIAL STATEMENT IMPACT The following table
summarizes share-based compensation expense (in thousands):
Fifty-Two Fifty-Three
Weeks Ended Weeks Ended
February 2, 2008 February 3, 2007
Stores and distribution expense $ 1,628 $ 2,419
Marketing, general and administrative expense 29,542 32,700
Operating income $31,170 $35,119
The Company also recognized $11.5 million and $12.2 million in
tax benefits related to share-based compensation for the fifty-two week
period ended February 2, 2008 and the fifty-three week period ended
February 3, 2007, respectively. Prior to the adoption of SFAS No.
123(R), the Company recognized $1.4 million in tax benefits related to
restricted stock units for the fifty-two week period ended January 28, 2006.
The following table is presented for comparative purposes and
illustrates the pro forma effect on net income and net income per
share for the fifty-two weeks ended January 28, 2006, as if the
Company had applied the fair value recognition provisions of SFAS
No. 123 to stock options granted under the Company’s share-based
compensation plans prior to January 29, 2006:
(Thousands, except per share amounts) Fifty-Two
Weeks Ended
January 28, 2006
Net income:
As reported $333,986
Share-based compensation expense included
in reported net income, net of tax(1) 14,716
Share-based compensation expense determined
under fair value based method, net of tax (36,689)
Pro forma $312,013
Net income per basic share:
As reported $3.83
Pro forma $3.58
Net income per diluted share:
As reported $3.66
Pro forma $3.38
(1)Includes share-based compensation expense related to restricted stock unit awards actually recognized
in net income in each period presented using the intrinsic value method.
Share-based compensation expense is recognized, net of estimated
forfeitures, over the requisite service period on a straight line basis. The
Company adjusts share-based compensation expense on a quarterly basis
for actual forfeitures and for changes to the estimate of expected award
forfeitures based on actual forfeiture experience. The effect of adjusting
the forfeiture rate is recognized in the period the forfeiture estimate is
changed. The effect of adjustments for forfeitures during the thirteen
and fifty-two week periods ended February 2, 2008 and the fourteen and
fifty-three week periods ended February 3, 2007 was immaterial.
A&F issues shares of Common Stock for stock option exercises and
restricted stock unit vestings from treasury stock. As of February 2, 2008,
A&F had enough treasury stock available to cover stock options and restrict-
ed stock units outstanding without having to repurchase additional shares.
PLANS As of February 2, 2008, A&F had two primary share-based com-
pensation plans including the following: the 2005 Long-Term Incentive
Plan (the “2005 LTIP”), under which A&F grants stock options and
restricted stock units to associates of the Company and non-associate
members of the A&F Board of Directors, and the 2007 Long-Term
Incentive Plan (the “2007 LTIP”), under which A&F grants stock options
and restricted stock units to associates of the Company. A&F also has
four other share-based compensation plans under which it granted stock
options and restricted stock units to associates of the Company and non-
associate members of the A&F Board of Directors in prior years.
The 2007 LTIP, a shareholder approved plan, permits A&F to
grant up to 5.0 million shares of A&F’s Common Stock to any associ-
ate of the Company eligible to receive awards under the 2007 LTIP.
The 2005 LTIP, a shareholder approved plan, permits A&F to grant
up to approximately 2.0 million shares of A&F’s Common Stock to
any associate of the Company (other than Michael S. Jeffries) who
is subject to Section 16 of the Securities Exchange Act of 1934, as
amended, at the time of the grant and any non-associate director of
A&F is eligible to receive awards under the 2005 LTIP. Under both
plans, stock options and restricted stock units vest primarily over
four years for associates. Under the 2005 LTIP, stock options and
restricted stock units vest over one year for non-associate directors of
A&F. Stock options have a ten-year term, subject to forfeiture under
the terms of the plans, and the plans provide for accelerated vesting