Abercrombie & Fitch 2004 Annual Report Download - page 7
Download and view the complete annual report
Please find page 7 of the 2004 Abercrombie & Fitch annual report below. You can navigate through the pages in the report by either clicking on the pages listed below, or by using the keyword search tool below to find specific information within the annual report.-
 1
1 -
 2
2 -
 3
3 -
 4
4 -
 5
5 -
 6
6 -
 7
7 -
 8
8 -
 9
9 -
 10
10 -
 11
11 -
 12
12 -
 13
13 -
 14
14 -
 15
15 -
 16
16 -
 17
17 -
 18
18 -
19
-
20
-
21
-
22
-
23
 |
 |

Abercrombie &Fitch
11
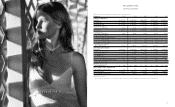
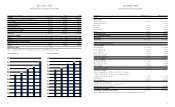
FINANCIAL SUMMARY
(Thousands except per share and per square foot amounts, ratios and store and associate data)
Fiscal Year 2004 2003 2002 2001 2000*
Summary of Operations
Net Sales $2,021,253 $1,707,810 $1,595,757 $ 1,364,853 $1,237,604
Gross Income $ 909,793 $ 716,944 $ 655,747 $ 554,580 $ 507,241
Operating Income $ 347,635 $ 331,180 $ 312,315 $ 268,004 $ 251,518
Operating Income as a
Percentage of Net Sales 17.2% 19.4% 19.6% 19.6% 20.3%
Net Income $ 216,376 $ 204,830 $ 194,754 $ 166,600 $ 156,853
Net Income as a
Percentage of Net Sales 10.7% 12.0% 12.2% 12.2% 12.7%
Dividends Paid per Share $ 0.50 –– ––
Per Weighted Average Share Results
Net Income per Basic Share $ 2.33 $000 2.12 $000 1.98 $00 0 1.68 $00 0 1.57
Net Income per Diluted Share $ 2.28 $0000 2.06 $00 0 1.94 $00 01.62 $00 0 1.54
Weighted Average Diluted
Shares Outstanding 95,110 99,580$100,631 0102,524 102,156
Other Financial Information
Total Assets $1,347,701 $1,383,229 $1,173,074 $ 916,485 $ 692,555
Return on Average Assets 16% 16% 19% 21% 26%
Capital Expenditures $ 185,065 $0159,777 $0145,662 $ 0171,673 $ 194,604
Long-Term Debt –––––
Shareholders’ Equity $ 669,326 $ 857,765 $ 736,307 $ 582,395 $ 411,733
Return on Average Shareholders’ Equity 28% 26% 30% 34% 44%
Comparable Store Sales** 2% (9%) (5%) (9%) (7%)
Retail Sales per Average
Gross Square Foot $ 360 $ 00 0345 $000 , 379 $ 401 $ 474
Stores and Associates at End of Year
Total Number of Stores Open 788 700 597 491 354
Gross Square Feet 5,590,000 5,016,000 4,358,000 3,673,000 2,849,000
Average Number of Associates 48,500 30,200 22,000 16,700 13,900
* Fifty-three week fiscal year.
** A store is included in comparable store sales when it has been open at least one year and its square footage has not been expanded or reduced by more than 20%.