Abercrombie & Fitch 2004 Annual Report Download - page 14
Download and view the complete annual report
Please find page 14 of the 2004 Abercrombie & Fitch annual report below. You can navigate through the pages in the report by either clicking on the pages listed below, or by using the keyword search tool below to find specific information within the annual report.-
 1
1 -
2
-
3
-
 4
4 -
 5
5 -
 6
6 -
 7
7 -
 8
8 -
 9
9 -
 10
10 -
 11
11 -
 12
12 -
 13
13 -
 14
14 -
 15
15 -
 16
16 -
 17
17 -
 18
18 -
 19
19 -
 20
20 -
 21
21 -
 22
22 -
 23
23
 |
 |
Abercrombie &Fitch
25
CONSOLIDATED BALANCE SHEETS
(Thousands) January 29, 2005 January 31, 2004
Assets
Current Assets
Cash and Equivalents $ 350,368 $ 56,373
Marketable Securities –464,700
Receivables 26,127 7,197
Inventories 211,198 170,703
Store Supplies 36,536 29,993
Other 28,048 23,689
Total Current Assets 652,277 752,655
Property and Equipment, Net 687,011 630,022
Other Assets 8,413 552
Total Assets $1,347,701 $1,383,229
Liabilities and Shareholders’ Equity
Current Liabilities
Accounts Payable $0 83,760 $ 58,191
Outstanding Checks 53,577 33,173
Accrued Expenses 234,210 163,389
Deferred Lease Credits 31,135 26,627
Income Taxes Payable 11,183 29,692
Total Current Liabilities 413,865 311,072
Long Term Liabilities
Deferred Income Taxes $0 55,346 $ 31,236
Deferred Lease Credits 177,923 154,768
Other Liabilities 31,241 28,388
Total Long-Term Liabilities 264,510 214,392
Shareholders’ Equity
Class A Common Stock – $.01 par value: 150,000,000 shares
authorized and 103,300,000 shares issued at January 29, 2005
and January 31, 2004, respectively $0 1,033 $ 1,033
Paid-In Capital 140,251 139,139
Retained Earnings (Deficit) 1,076,023 906,085
Treasury Stock, at Average Cost
17,262,943 and 8,692,501 shares at January 29, 2005
and January 31, 2004, respectively (547,981) (188,492)
Total Shareholders’ Equity $669,326 $857,765
Total Liabilities and Shareholders’ Equity $1,347,701 $1,383,229
The accompanying Notes are an integral part of these Consolidated Financial Statements.
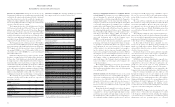
Abercrombie &Fitch
24
CONSOLIDATED STATEMENTS OF INCOME
2004 2003 2002
$2,021,253 $1,707,810 $1,595,757
1,111,460 990,866 940,010
909,793 716,944 655,747
562,158 385,764 343,432
347,635 331,180 312,315
(5,218) (3,708) (3,768)
352,853 334,888 316,083
136,477 130,058 121,329
$ 216,376 $ 204,830 $ 194,754
$ 2.33 $ 2.12 $ 14,1.98
$ 2.28 $ 2.06 $ 14,1.94
92,777 96,833 98,171
95,110 99,580 100,631
$0.50 – –
(Thousands except per share amounts)
Net Sales
Cost of Goods Sold, Occupancy and Buying Costs
Gross Income
General, Administrative and Store Operating Expenses
Operating Income
Interest Income, Net
Income Before Income Taxes
Provision for Income Taxes
Net Income
Net Income Per Share:
Basic
Diluted
Weighted-Average Shares Outstanding:
Basic
Diluted
Dividends Per Share:
The accompanying Notes are an integral part of these Consolidated Financial Statements.
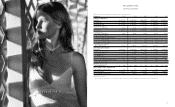
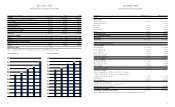
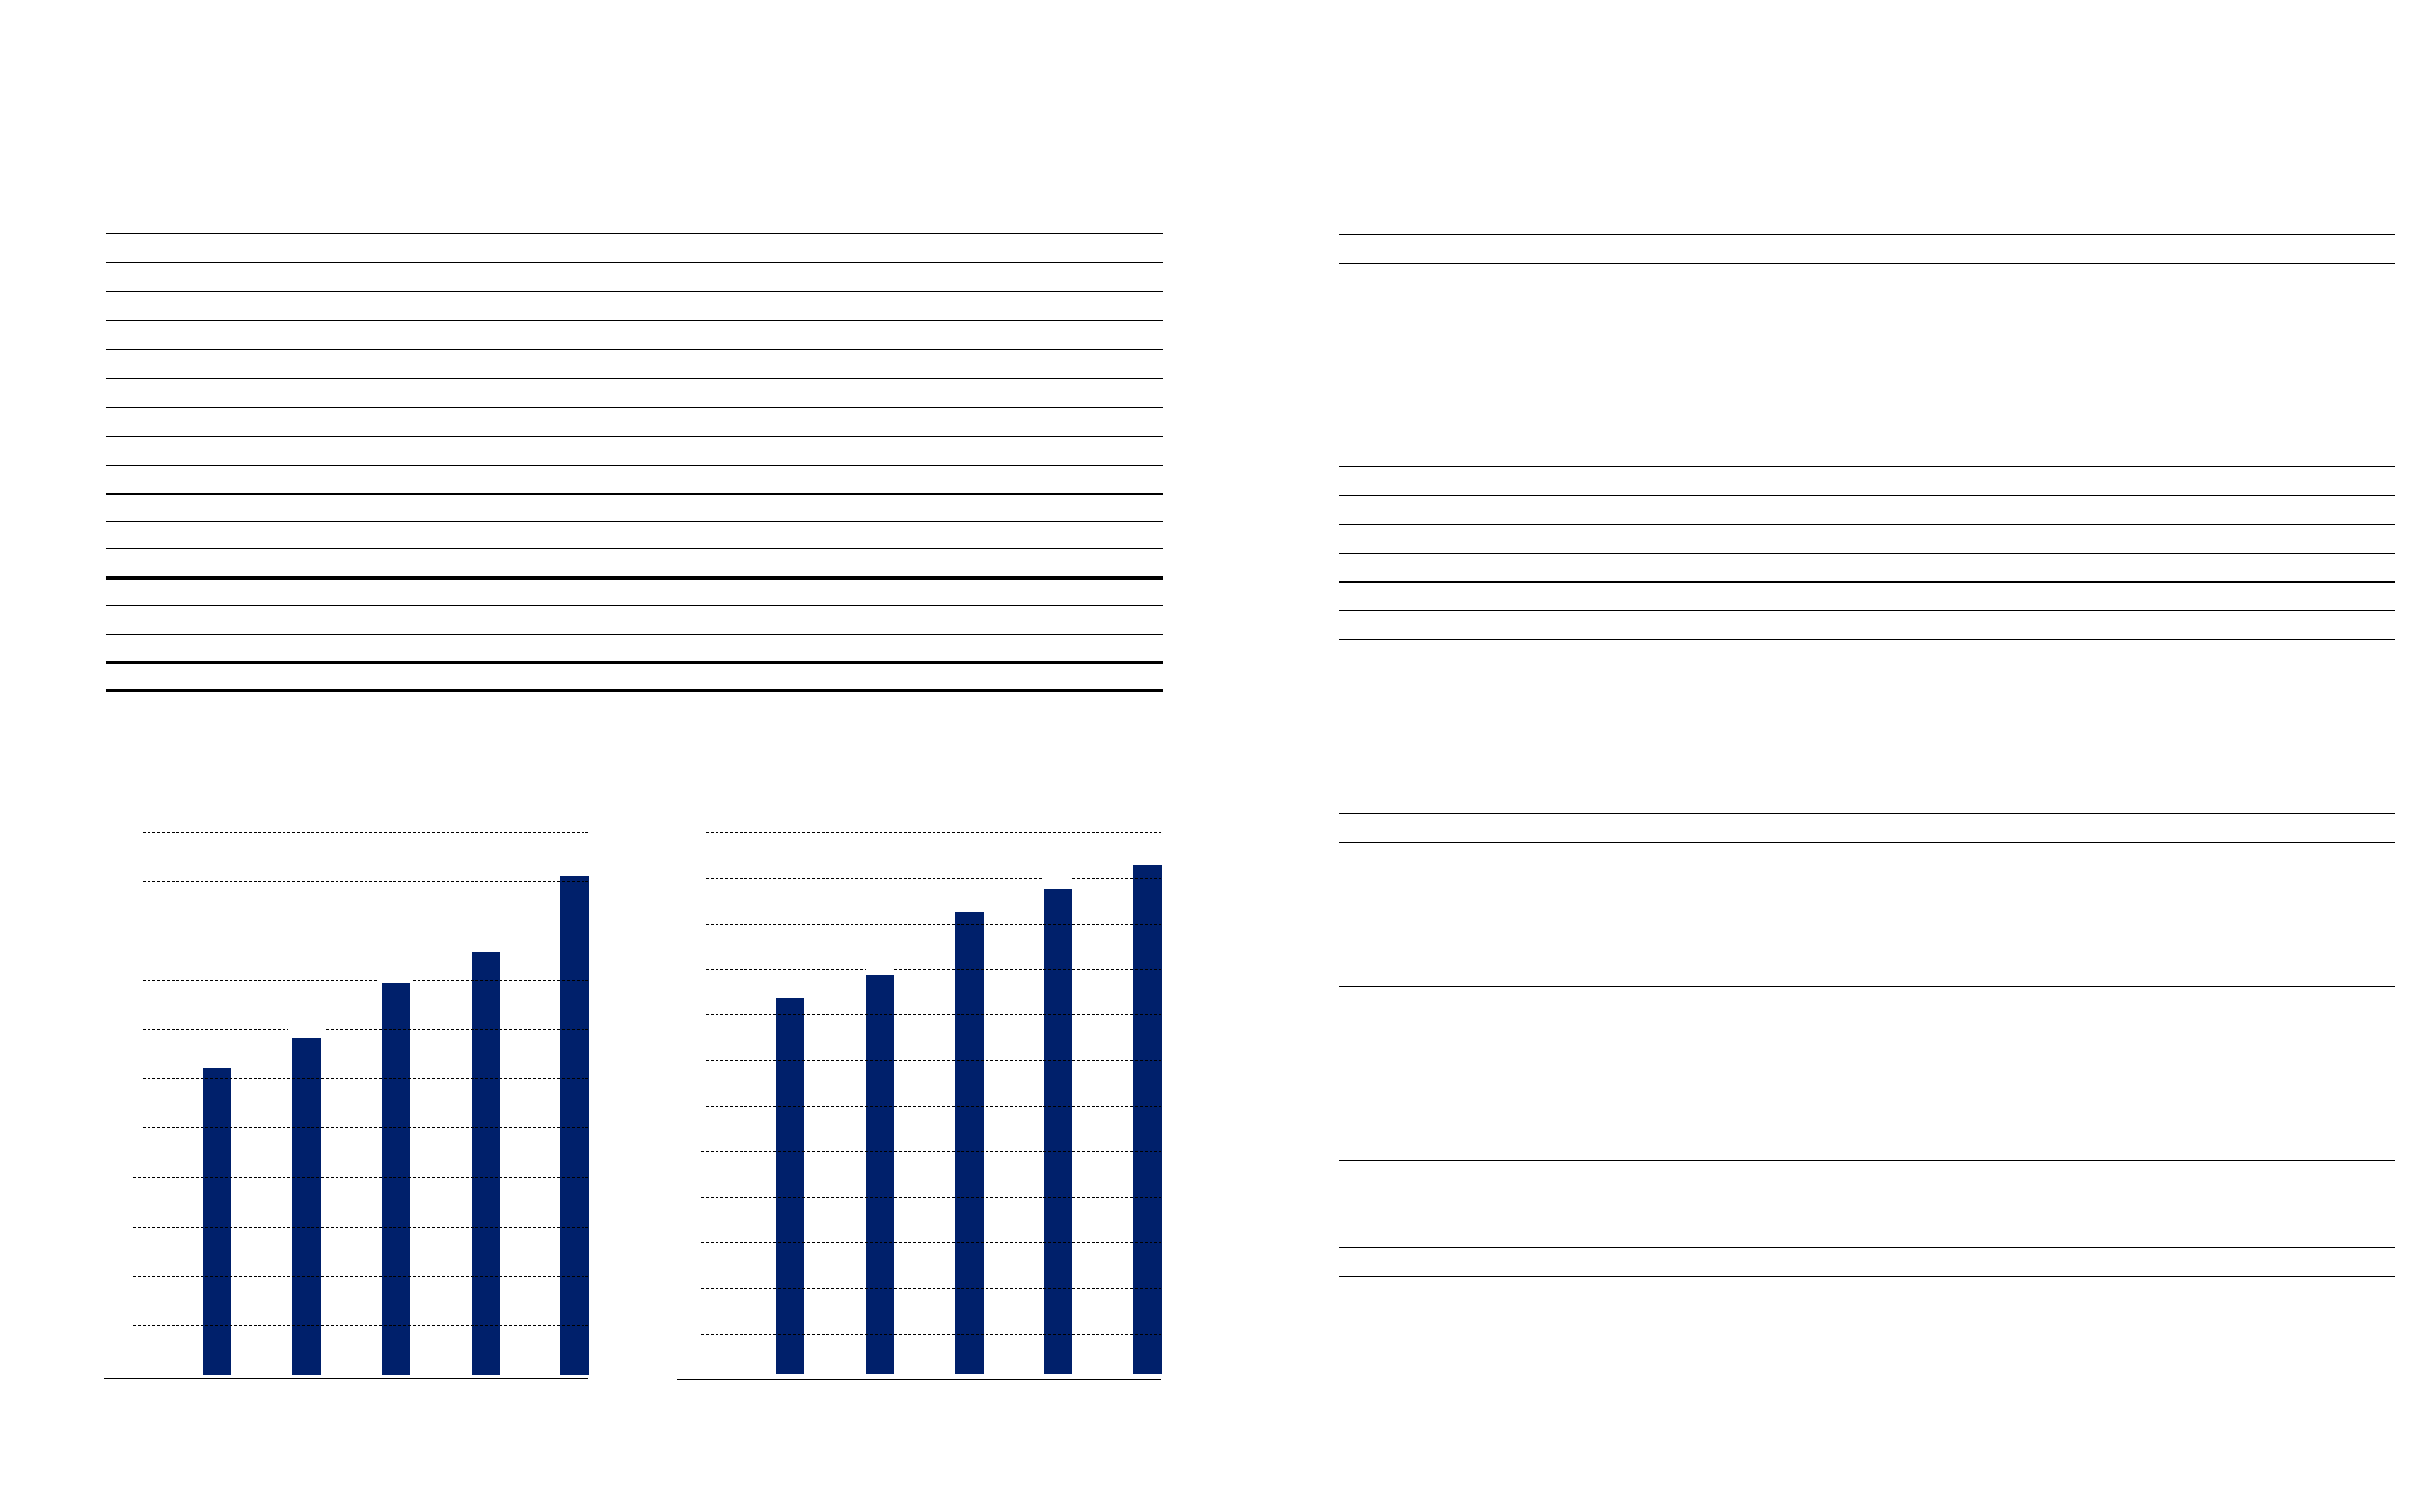
2000 2001 2002 2003 2004
$200
$400
$600
$800
$1,000
$1,200
$1,400
$1,800
$2,000
$2,200
$1,238
$1,365
$1,708
$2,021
Net Sales ($ in Millions) Net Income ($ in Millions)
2000 2001 2002 2003 2004
$10
$30
$50
$70
$90
$110
$130
$150
$170
$190
$210
$230
$157
$167
$195
$205
$216
$1,600 $1,596