Abercrombie & Fitch 2004 Annual Report Download - page 11
Download and view the complete annual report
Please find page 11 of the 2004 Abercrombie & Fitch annual report below. You can navigate through the pages in the report by either clicking on the pages listed below, or by using the keyword search tool below to find specific information within the annual report.-
 1
1 -
 2
2 -
 3
3 -
 4
4 -
 5
5 -
 6
6 -
 7
7 -
 8
8 -
 9
9 -
 10
10 -
 11
11 -
 12
12 -
 13
13 -
 14
14 -
 15
15 -
 16
16 -
 17
17 -
 18
18 -
 19
19 -
 20
20 -
 21
21 -
 22
22 -
23
 |
 |

stock at a cost of $434.7 million. The increase in working capital
in fiscal 2003 versus fiscal 2002 was the result of higher cash and
marketable securities.
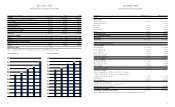
The Company considers the following to be measures of liquidity
and capital resources:
2004 2003 2002
Current ratio (current assets divided
by current liabilities) 1.58 2.42 2.32
Net cash provided by
operating activities (in thousands) $426,125 $342,545 $345,832
The increase in cash provided by operating activities in the 2004
fiscal year from the 2003 fiscal year was primarily driven by increas-
es in net income, accounts payable and accrued expenses, lessor con-
struction allowances received and income taxes. The increase in
accounts payable and accrued expenses was primarily due to the
accrual for the settlement of three related class action employment
discrimination lawsuits, for rent due to the net addition of 88 stores,
representing an increase of 574,000 gross square feet in 2004, and
increases in accounts payable for the purchase of merchandise.
The decrease in cash provided by operating activities in the 2003
fiscal year from the 2002 fiscal year was primarily driven by an
increase in inventories not offset by commensurate increases in net
income, lessor construction allowances, accounts payable and
accrued expenses. Inventories increased from the net addition of 103
stores representing an increase of 658,000 gross square feet in 2003.
Inventories at fiscal year-end were 3% higher on a per gross square
foot basis than at the end of the 2002 fiscal year.
The increase in cash provided by operating activities in the 2002
fiscal year from the 2001 fiscal year was primarily due to increases in
lessor construction allowances, accounts payable and accrued
expenses, and income taxes payable. Accounts payable increased in
the 2002 fiscal year due to both the increased level of inventory and
timing of payments. Accrued expenses increased in the 2002 fiscal
year primarily due to higher store expenses, consistent with the
increase in store openings. The increase in income taxes payable was
driven by higher pre-tax income and timing of payments.
The Company’s operations are seasonal in nature and typically
peak during the Back-to-School and Holiday selling periods.
Accordingly, cash requirements for inventory expenditures are highest
during these periods.
Cash outflows during the 2004 fiscal year related to investing
activities were primarily for purchase of marketable securities and
for capital expenditures related to new stores, the remodeling of
existing stores, expenditures in home office, improvements in the
distribution center, and information technology expenditures. See
“Capital Expenditures and Lessor Construction Allowances”.
Cash inflows from investing activities consisted of proceeds from
the sale of marketable securities. As of January 29, 2005, all invest-
ments had original maturities of less than 90 days and accordingly
were classified as cash equivalents.
Cash outflows during the 2003 fiscal year also related to purchas-
es of marketable securities and capital expenditures related to new
stores with approximately $35 million invested in the completion of
the home office expansion, improvements in the distribution center
and information technology expenditures for a new point-of-sale sys-
tem. This system was completely rolled-out to all stores during
the third quarter of the 2003 fiscal year. Cash inflows from investing
activities consisted of proceeds from the sale of marketable securities.
As of January 31, 2004, the Company held $464.7 million of mar-
ketable securities with original maturities of greater than 90 days.
Financing activities during the 2004, 2003 and 2002 fiscal years
consisted primarily of the repurchase of 11,150,500 shares, 4,401,000
shares, and 1,850,000 shares, respectively, of A&F’s Class A Common
Stock pursuant to previously authorized stock repurchase programs.
After the repurchases in 2004, the Company had 1,448,500 shares
available to repurchase as of January 29, 2005 of the 6,000,000
shares authorized by the Board of Directors in November 2004. In
addition to stock repurchases, financing activities also consisted of
stock option exercises, restricted stock issuances and overdrafts.
These overdrafts are outstanding checks reclassified from cash to
accounts payable.
Effective December 15, 2004, the Company entered into an
amended and restated $250 million syndicated unsecured credit
agreement, (the "Amended Credit Agreement") which extended
the original agreement, dated November 14, 2002 (the "Original
Credit Agreement"). The Amended Credit Agreement will expire
on December 15, 2009. The primary purpose of the Amended
Credit Agreement is for letters of credit (trade and stand-by) and
working capital. The Amended Credit Agreement has several
borrowing options, including interest rates that are based on the
agent banks “Alternate Base Rate,” or a LIBO rate. The facility
fees payable under the Amended Credit Agreement are based on
the Company’s ratio (the “leverage ratio”) of the sum of total debt
plus 600% of forward minimum rent commitments to consolidated
earnings before interest, taxes, depreciation, amortization and rent
(“EBITDAR”) for the trailing four-fiscal-quarter period. The
facility fees are projected to accrue at .175% on the committed
amounts per annum. The remaining terms of the Amended Credit
Agreement are similar to the Original Credit Agreement. Additional
details regarding the Credit Agreement can be found in the Notes
to Consolidated Financial Statements (see Note 8).
Letters of credit totaling approximately $49.6 million and
Abercrombie &FitchAbercrombie &Fitch
Back-to-School 2003. Shipping and handling revenue for the
corresponding periods was $10.2 million in 2003 and $7.8 million
in 2002. The direct-to-consumer business, including shipping and
handling revenue, accounted for 5.3% of net sales compared to
4.6% for the 2003 and 2002 fiscal years, respectively.
GROSS INCOME The Company’s gross income may not be com-
parable to those of other retailers since all significant costs related
to the Company’s distribution network, excluding direct shipping
costs related to the direct-to-consumer sales, are included in gen-
eral, administrative and store operating expenses (see “General,
Administrative and Store Operating Expenses” section below).
For the 2003 fiscal year, gross income increased to $716.9 mil-
lion from $655.7 million in the 2002 fiscal year. The gross income
rate in the 2003 fiscal year was 42.0% versus 41.1% in the 2002 fis-
cal year. The increase was driven by improvements in IMU that
were partially offset by increased buying and occupancy costs as a
percentage of net sales.
Buying and occupancy costs increased versus fiscal 2002, as a
percentage of net sales, due to the inability to leverage fixed expenses
with lower sales volume per average store.
GENERAL, ADMINISTRATIVE AND STORE OPERATING
EXPENSES Full year general, administrative and store operating
expenses were $385.8 million in the 2003 fiscal year versus $343.4
million in the 2002 fiscal year. The general, administrative and store
operating expense rate in the 2003 fiscal year was 22.6% versus
21.5% in the 2002 fiscal year. The increased rate in the 2003 fiscal
year resulted primarily from a drop in comparable store sales that
could not be offset by lower variable expenses per average store. In
addition, legal expense increased in the 2003 fiscal year compared to
the 2002 fiscal year as the Company reserved expected defense costs
for pending litigation. Partially offsetting these costs were improve-
ments in distribution center productivity, reduced expenses per order
in the direct-to-consumer business and reduced marketing expens-
es, as a percentage of net sales, due to savings from fewer direct mail
campaigns in the 2003 fiscal year.
Productivity at the distribution center, as measured in units
processed per labor hour, was 31% higher during the 2003 fiscal year
than during the 2002 fiscal year. Costs related to the distribution
center, excluding direct shipping costs related to the direct-to-con-
sumer sales, included in general, administrative and store operating
expenses were $19.3 million in the 2003 fiscal year compared to
$19.9 million in the 2002 fiscal year.
OPERATING INCOME For the 2003 fiscal year, operating income
was $331.2 million compared to $312.3 million for the 2002 fiscal
year. The operating income rate for the 2003 fiscal year was 19.4%
versus 19.6% in the 2002 fiscal year. The decline was attributable
to a higher general, administrative and store operating expense rate
due to the inability to leverage fixed costs on a comparable store
sales decrease. The increased expense rate was partially offset by a
gross income rate increase.
INTEREST INCOME AND INCOME TAXES Net interest income
for the 2003 fiscal year was $3.7 million compared to $3.8 million in
the 2002 fiscal year. The decline in the 2003 fiscal year net interest
income was due to lower interest rates. The Company continued to
invest in tax-free securities. The effective tax rate for the 2003 fiscal
year was 38.8% compared to 38.4% for the 2002 fiscal year.
NET INCOME AND NET INCOME PER SHARE Net income for
the 2003 fiscal year was $204.8 million versus $194.8 million for the
2002 fiscal year, an increase of 5.1%. Net income per weighted-
average diluted share was $2.06 in the fiscal 2003 year versus $1.94
in the fiscal 2002 year, an increase of 6.2%. The increase in net
income per diluted share outstanding versus net income was due to
the Company’s repurchase program in fiscal 2003. The Company
repurchased 4.4 million shares in fiscal 2003 versus 1.9 million
shares in fiscal 2002.
FINANCIAL CONDITION Continued growth in net income
resulted in higher cash provided by operating activities. A more
detailed discussion of liquidity, capital resources and capital
requirements follows.
LIQUIDITY AND CAPITAL RESOURCES The Company believes
cash provided by operating activities and cash on hand will provide
adequate resources to support operations, including projected growth,
seasonal requirements and capital expenditures. Furthermore, the
Company expects that cash from operating activities will fund
dividends currently being paid at a rate of $0.125 per quarter. The
Board of Directors will review and approve the appropriateness of
future dividend amounts. A summary of the Company's working
capital (current assets less current liabilities) position and capital-
ization follows (in thousands):
2004 2003 2002
Working capital $238,412 $441,583 $357,585
Capitalization:
Shareholders’ equity $669,326 $857,765 $736,307
The decrease in working capital in fiscal 2004 versus fiscal 2003 was
the result of lower cash and marketable securities resulting primarily
from the Company’s repurchase of 11.2 million shares of common
18 19