Abercrombie & Fitch 2004 Annual Report Download - page 17
Download and view the complete annual report
Please find page 17 of the 2004 Abercrombie & Fitch annual report below. You can navigate through the pages in the report by either clicking on the pages listed below, or by using the keyword search tool below to find specific information within the annual report.
Abercrombie &Fitch
For construction allowances, the Company records a deferred
lease credit on the consolidated balance sheet and amortizes the
deferred lease credit as a reduction to rent expense on the consoli-
dated statement of income over the terms of the leases. For sched-
uled rent escalation clauses during the lease terms, the Company
records minimum rental expenses on a straight-line basis over the
terms of the leases on the consolidated statement of income. The
term of the lease over which the Company amortizes construction
allowances and minimum rental expenses on a straight-line basis
begins on the date of initial possession, which is generally when
the Company enters the space and begins to make improvements
in preparation of intended use.
Certain leases provide for contingent rents, which are deter-
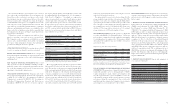
mined as a percentage of gross sales in excess of specified levels.
The Company records a contingent rent liability in accrued
expenses on the consolidated balance sheets and the corresponding
rent expense when management determines that achieving the
specified levels during the fiscal year is probable.
STORE PREOPENING EXPENSES Pre-opening expenses related
to new store openings are charged to operations as incurred.
DESIGN AND DEVELOPMENT COSTS Costs to design and
develop the Company’s merchandise are expensed as incurred and
are reflected as a component of “Cost of Goods Sold, Occupancy
and Buying Costs.”
FAIR VALUE OF FINANCIAL INSTRUMENTS The recorded
values of current assets and current liabilities, including receivables,
marketable securities and accounts payable, approximate fair value
due to the short maturity and because the average interest rate
approximates current market origination rates.
STOCK-BASED COMPENSATION The Company reports stock-
based compensation through the disclosure-only requirements
of SFAS No. 123 (“SFAS 123”), “Accounting for Stock-Based
Compensation,” as amended by SFAS No. 148, “Accounting for
Stock-Based Compensation–Transition and Disclosure–an
Amendment of FASB No. 123,” but elects to measure compensa-
tion expense using the intrinsic value method in accordance with
Accounting Principles Board Opinion No. 25, “Accounting for
Stock Issued to Employees.” Accordingly, no compensation
expense for options has been recognized as all options are grant-
ed at fair market value at the grant date. The Company does rec-
ognize compensation expense related to restricted share awards.
If compensation expense related to options had been determined
based on the estimated fair value of options granted in 2004, 2003
and 2002, consistent with the methodology in SFAS 123, the pro
forma effect on net income and net income per basic and diluted
share would have been as follows:
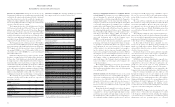
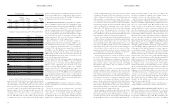
(Thousands except per share amounts) 2004 2003 2002
Net Income:
As reported $216,376 $204,830 $194,754
Stock-based compensation expense
included in reported net income, net of tax 6,358 3,250 1,414
Stock-based compensation expense
determined under fair value based method,
net of tax(1) (27,720) (27,274) (27,673)
Pro forma $195,014 $180,806 $168,495
Basic net income per share:
As reported $2.33 $2.12 $1.98
Pro forma $2.10 $1.87 $1.72
Diluted net income per share:
As reported $2.28 $2.06 $1.94
Pro forma $2.05 $1.83 $1.68
(1) Includes stock-based compensation expense related to restricted share awards actually
recognized in earnings in each period presented using the intrinsic value method.
The average weighted-average fair values of options were $15.05,
$14.18 and $12.07 for the 2004, 2003 and 2002 fiscal years, respec-
tively. The fair value of each option was estimated using the Black-
Scholes option-pricing model, which are included in the pro forma
results above. For purposes of the valuation, the following weight-
ed-average assumptions were used: a 1.28% dividend yield in the
2004 fiscal year and no expected dividends in the 2003 and 2002 fis-
cal years; average price volatility of 56%, 63% and 53% in the 2004,
2003 and 2002 fiscal years, respectively; average risk-free interest
rates of 3.2%, 3.0% and 4.3% in the 2004, 2003 and 2002 fiscal years,
respectively; assumed average forfeiture rates of 28%, 23% and 15%
for the 2004, 2003 and 2002 fiscal years; and vesting lives of 4 years
in the 2004, 2003 and 2002 fiscal years.
For options granted to non-associates directors during 2004, the
average weighted-average fair value of the options was $5.22. The
fair value of each option was estimated using the Black-Scholes
option-pricing model, which is included in the pro forma results
above. For purposes of the valuation, the following weighted-aver-
age assumptions were used: a 1.28% dividend yield; average price
volatility of 37%; average risk-free interest rate of 2.0%; assumed
average forfeiture rate of 12%; and vesting life of 1 year.
NET INCOME PER SHARE Net income per share is computed in
accordance with SFAS No. 128, “Earnings Per Share.” Net income
per basic share is computed based on the weighted-average number
of outstanding shares of common stock. Net income per diluted
share includes the weighted-average effect of dilutive stock options
and restricted shares.
Weighted–Average Shares Outstanding (thousands):
2004 2003 2002
Shares of Class A Common stock issued 103,300 103,300 103,300
Treasury shares oustanding (10,523) (6,467) (5,129)
Basic shares outstanding 92,777 96,833 98,171
Dilutive effect of options and
restricted shares 2,333 2,747 2,460
Diluted shares outstanding 95,110 99,580 100,631
Options to purchase 5,213,000, 6,151,000 and 9,218,000 shares of Class A Common
Stock were outstanding at year-end 2004, 2003 and 2002, respectively, but were not
included in the computation of net income per diluted share because the options’ exercise
prices were greater than the average market price of the underlying shares.
USE OF ESTIMATES IN THE PREPARATION OF FINANCIAL
STATEMENTS The preparation of financial statements in con-
formity with generally accepted accounting principles (“GAAP”)
requires management to make estimates and assumptions that
affect the reported amounts of assets and liabilities as of the date
of the financial statements and the reported amounts of revenues
and expenses during the reporting period. Since actual results
may differ from those estimates, the Company revises its estimates
and assumptions as new information becomes available.
RECLASSIFICATIONS Certain amounts have been reclassified to
conform to current year presentation. The amounts reclassified did
not have an effect on the Company’s results of operations or share-
holders’ equity.
3. RECENTLY ISSUED ACCOUNTING PRONOUNCEMENTS
In December 2004, the Financial Accounting Standards Board
("FASB") issued Statement No. 123R ("SFAS 123R"), "Share-
Based Payment," a revision of FASB issued Statement No. 123
("SFAS 123"), "Accounting for Stock-Based Compensation." SFAS
123R requires an entity to recognize compensation expense in an
amount equal to the fair value of share-based payments granted to
employees. The pro forma disclosures previously permitted under
SFAS 123 will no longer be an alternative to financial statement
recognition. See Note 2 of the Notes to Consolidated Financial
Statements for the pro forma net income and earnings per share
amounts for fiscal 2002 through fiscal 2004, as if the Company had
used a fair-value based method similar to the methods required
under SFAS 123R to measure compensation expense for employee
stock-based compensation awards. The accounting provisions of
SFAS 123R are effective for reporting periods beginning after June
15, 2005. The Company is still in the process of determining the
impact on the results of operations and financial position upon the
adoption of SFAS 123R.
4. PROPERTY AND EQUIPMENT Property and equipment, at
cost, consisted of (thousands):
2004 2003
Land $ 15,985 $ 15,985
Building 110,971 110,726
Furniture, fixtures and equipment 516,127 469,135
Leasehold improvements 402,535 332,231
Construction in progress 27,782 27,901
Beneficial leaseholds 12 5,839
Total $1,073,412 $961,817
Less: Accumulated depreciation and amortization 386,401 331,795
Property and equipment, net $ 687,011 $630,022
Abercrombie &Fitch
30 31


