Abercrombie & Fitch 2002 Annual Report Download - page 7
Download and view the complete annual report
Please find page 7 of the 2002 Abercrombie & Fitch annual report below. You can navigate through the pages in the report by either clicking on the pages listed below, or by using the keyword search tool below to find specific information within the annual report.-
 1
1 -
 2
2 -
 3
3 -
 4
4 -
 5
5 -
 6
6 -
 7
7 -
 8
8 -
 9
9 -
 10
10 -
 11
11 -
 12
12 -
 13
13 -
 14
14 -
 15
15 -
 16
16 -
 17
17 -
 18
18 -
19
-
20
-
21
-
22
-
23
-
24
-
25
-
26
-
27
-
28
-
29
-
30
-
31
-
32
 |
 |

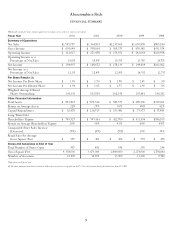
FINANCIAL SUMMARY The following summarized financial
data compares the 2002 fiscal year to the comparable periods
for 2001 and 2000:
% Change
2001- 2000-
2002 2001 2000 2002 2001
Net sales (millions) $1,595.8 $1,364.9 $1,237.6 17% 10%
Decrease in comparable
store sales (5%) (9%) (7%)
Retail sales increase attributable
to new and remodeled stores,
magazine, catalogue and Web sites 22% 19% 27%
Retail sales per average
gross square foot $0,379 $0,401 $0,474 (5%) (15%)
Retail sales per average store
(thousands) $2,797 $3,095 $3,944 (10%) (22%)
Average store size at year-end
(gross square feet) 7,300 7,480 8,047 (2%) (7%)
Gross square feet at year-end
(thousands) 4,358 3,673 2,849 19% 29%
Number of stores and
gross square feet by concept:
Abercrombie & Fitch:
Stores at beginning of period 309 265 215
Opened 33 45 50
Closed (2))(1) –
Stores at end of period 340 309 265
Gross square feet (thousands) 3,036 2,798 2,443
abercrombie:
Stores at beginning of period 148 84 35
Opened 19 64 49
Closed (3) )– –
Stores at end of period 164 148 84
Gross square feet (thousands) 727 662 375
Hollister Co.:
Stores at beginning of period 34 5 –
Opened 60 29 5
Closed (1))– –
Stores at end of period 93 34 5
Gross square feet (thousands) 595 213 31
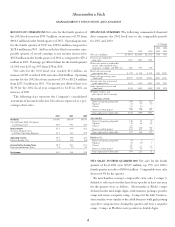
NET SALES: FOURTH QUARTER 2002 Net sales for the fourth
quarter of fiscal 2002 were $534.5 million, up 15% over 2001’s
fourth quarter net sales of $466.6 million. Comparable store sales
decreased 4% for the quarter.
By merchandise concept, comparable store sales (“comps”),
defined as sales in stores that have been open for at least one year,
for the quarter were as follows: Abercrombie & Fitch’s comps
declined in the mid-single digits, with womens posting a positive
comp and mens a negative comp. Comps for the kids’ business,
abercrombie, were similar to the adult business with girls posting
a positive comp increase during the quarter and boys a negative
comp. Comps in Hollister were positive in double digits.
RESULTS OF OPERATIONS Net sales for the fourth quarter of
the 2002 fiscal year were $534.5 million, an increase of 15% from
$466.6 million for the fourth quarter of 2001. Operating income
for the fourth quarter of 2002 was $149.6 million compared to
$128.6 million in 2001. A&F recorded its 42nd consecutive com-
parable quarter of record earnings as net income increased to
$92.8 million in the fourth quarter of 2002 as compared to $79.2
million in 2001. Earnings per diluted share for the fourth quarter
of 2002 were $.93, up 19% from $.78 in 2001.
Net sales for the 2002 fiscal year reached $1.6 billion, an
increase of 17% over fiscal 2001 net sales of $1.4 billion. Operating
income for the 2002 fiscal year increased 15% to $312.6 million
from $271.5 million in 2001. Net income per diluted share was
$1.94 for the 2002 fiscal year compared to $1.65 in 2001, an
increase of 18%.
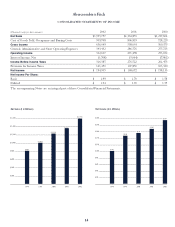
The following data represent the Company’s consolidated
statements of income for the last 3 fiscal years expressed as a per-
centage of net sales:
2002 2001 2000
Net Sales 100.0% 100.0% 100.0%
Cost of Goods Sold, Occupancy
and Buying Costs 58.9 59.1 58.8
Gross Income 41.1 40.9 41.2
General, Administrative
and Store Operating Expenses 21.5 21.0 20.7
Operating Income 19.6 19.9 20.5
Interest Income, Net (0.2) (0.4) (0.6)
Income Before Income Taxes 19.8 20.3 21.1
Provision for Income Taxes 7.6 7.9 8.3
Net Income 12.2 12.4 12.8
MANAGEMENT’S DISCUSSION AND ANALYSIS
Abercrombie &Fitch
4