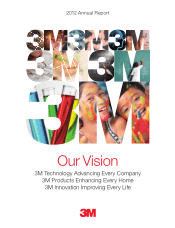
3M 2012 Annual Report Download - page 6
Download and view the complete annual report
Please find page 6 of the 2012 3M annual report below. You can navigate through the pages in the report by either clicking on the pages listed below, or by using the keyword search tool below to find specific information within the annual report.-
 1
1 -
 2
2 -
 3
3 -
 4
4 -
 5
5 -
 6
6 -
 7
7 -
 8
8 -
 9
9 -
 10
10 -
 11
11 -
 12
12 -
 13
13 -
 14
14 -
 15
15 -
 16
16 -
 17
17 -
18
-
19
-
20
-
21
-
22
-
23
-
24
-
25
-
26
-
27
-
28
-
29
-
30
-
31
-
32
-
33
-
34
-
35
-
36
-
37
-
38
-
39
-
40
-
41
-
42
-
43
-
44
-
45
-
46
-
47
-
48
-
49
-
50
-
51
-
52
-
53
-
54
-
55
-
56
-
57
-
58
-
59
-
60
-
61
-
62
-
63
-
64
-
65
-
66
-
67
-
68
-
69
-
70
-
71
-
72
-
73
-
74
-
75
-
76
-
77
-
78
-
79
-
80
-
81
-
82
-
83
-
84
-
85
-
86
-
87
-
88
-
89
-
90
-
91
-
92
-
93
-
94
-
95
-
96
-
97
-
98
-
99
-
100
-
101
-
102
-
103
-
104
-
105
-
106
-
107
-
108
-
109
-
110
-
111
-
112
-
113
-
114
-
115
-
116
-
117
-
118
-
119
-
120
-
121
-
122
-
123
-
124
-
125
-
126
-
127
-
128
-
129
-
130
-
131
-
132
 |
 |

4
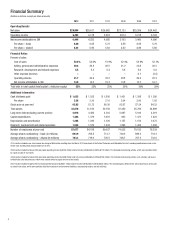
Financial Summary
(Dollars in millions, except per share amounts)
2012 2011 2010 2009 2008 2007
Operating Results
Net sales $29,904 $29,611 $26,662 $23,123 $25,269 $24,462
Operating income 6,483 6,178 5,918 4,814 5,218 6,193
Net income attributable to 3M 4,444 4,283 4,085 3,193 3,460 4,096
Per share – basic 6.40 6.05 5.72 4.56 4.95 5.70
Per share – diluted 6.32 5.96 5.63 4.52 4.89 5.60
Financial Ratios
Percent of sales
Cost of sales 52.4% 53.0% 51.9% 52.4% 52.9% 52.1%
Selling, general and administrative expenses 20.4 20.8 20.5 21.2 20.8 20.5
Research, development and related expenses 5.5 5.3 5.4 5.6 5.6 5.6
Other expense (income) – – – – 0.1 (3.5)
Operating income 21.7 20.9 22.2 20.8 20.6 25.3
Net income attributable to 3M 14.9 14.5 15.3 13.8 13.7 16.7
Total debt to total capital (total capital = debt plus equity) 25% 25% 25% 30% 39% 29%
Additional Information
Cash dividends paid $ 1,635 $ 1,555 $ 1,500 $ 1,431 $ 1,398 $ 1,380
Per share 2.36 2.20 2.10 2.04 2.00 1.92
Stock price at year-end 92.85 81.73 86.30 82.67 57.54 84.32
Total assets 33,876 31,616 30,156 27,250 25,793 24,699
Long-term debt (excluding current portion) 4,916 4,484 4,183 5,097 5,166 4,019
Capital expenditures 1,484 1,379 1,091 903 1,471 1,422
Depreciation and amortization 1,288 1,236 1,120 1,157 1,153 1,072
Research, development and related expenses 1,634 1,570 1,434 1,293 1,404 1,368
Number of employees at year-end 87,677 84,198 80,057 74,835 79,183 76,239
Average shares outstanding – basic (in millions) 693.9 708.5 713.7 700.5 699.2 718.3
Average shares outstanding – diluted (in millions) 703.3 719.0 725.5 706.7 707.2 732.0
2010 results included a one-time income tax charge of $84 million resulting from the March 2010 enactment of the Patient Protection and Affordable Care Act, including modifications made in the
Health Care and Education Reconciliation Act of 2010.
2009 results included net losses that decreased operating income by $194 million and net income attributable to 3M by $119 million. This included restructuring actions, which were partially offset
by a gain on sale of real estate.
2008 results included net losses that decreased operating income by $269 million and net income attributable to 3M by $194 million. This included restructuring actions, exit activities and losses
related to the sale of businesses, which were partially offset by a gain on sale of real estate.
2007 results included net gains that increased operating income by $681 million and net income attributable to 3M by $448 million. This included gains related to the sale of businesses and a gain
on sale of real estate, which were partially offset by increases in environmental liabilities, restructuring actions and exit activities.