3M 2012 Annual Report Download - page 22
Download and view the complete annual report
Please find page 22 of the 2012 3M annual report below. You can navigate through the pages in the report by either clicking on the pages listed below, or by using the keyword search tool below to find specific information within the annual report.-
 1
1 -
2
-
3
-
4
-
5
-
6
-
7
-
8
-
9
-
10
-
11
-
 12
12 -
 13
13 -
 14
14 -
 15
15 -
 16
16 -
 17
17 -
 18
18 -
 19
19 -
 20
20 -
 21
21 -
 22
22 -
 23
23 -
 24
24 -
 25
25 -
 26
26 -
 27
27 -
 28
28 -
 29
29 -
 30
30 -
 31
31 -
 32
32 -
33
-
34
-
35
-
36
-
37
-
38
-
39
-
40
-
41
-
42
-
43
-
44
-
45
-
46
-
47
-
48
-
49
-
50
-
51
-
52
-
53
-
54
-
55
-
56
-
57
-
58
-
59
-
60
-
61
-
62
-
63
-
64
-
65
-
66
-
67
-
68
-
69
-
70
-
71
-
72
-
73
-
74
-
75
-
76
-
77
-
78
-
79
-
80
-
81
-
82
-
83
-
84
-
85
-
86
-
87
-
88
-
89
-
90
-
91
-
92
-
93
-
94
-
95
-
96
-
97
-
98
-
99
-
100
-
101
-
102
-
103
-
104
-
105
-
106
-
107
-
108
-
109
-
110
-
111
-
112
-
113
-
114
-
115
-
116
-
117
-
118
-
119
-
120
-
121
-
122
-
123
-
124
-
125
-
126
-
127
-
128
-
129
-
130
-
131
-
132
 |
 |

16
insurance coverage which limited its exposure and resulted in some initial recovery in the fourth quarter of 2011 (as
discussed above).
In 2010, 3M recorded a one-time, non-cash income tax charge of $84 million, or 12 cents per diluted share, resulting from
the March 2010 enactment of the Patient Protection and Affordable Care Act, including modifications made in the Health
Care and Education Reconciliation Act of 2010. Refer to the special items discussion at the end of this overview section
for more detail.
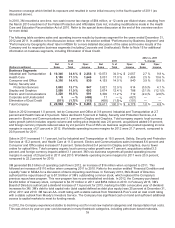
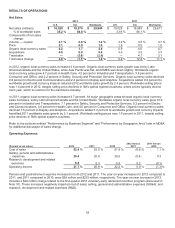
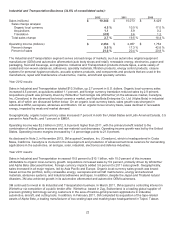
The following table contains sales and operating income results by business segment for the years ended December 31,
2012 and 2011. In addition to the discussion below, refer to the section entitled “Performance by Business Segment” and
“Performance by Geographic Area” later in MD&A for a more detailed discussion of the sales and income results of the
Company and its respective business segments (including Corporate and Unallocated). Refer to Note 15 for additional
information on business segments, including Elimination of Dual Credit.
2012 vs. 2011
2012
2011
% change
Net
% of
Oper.
Net
% of
Oper.
Net
Oper.
(Dollars in millions)
Sales
Total
Income
Sales
Total
Income
Sales
Income
Business Segments
Industrial and Transportation
$
10,346
34.6
%
$
2,258
$
10,073
34.0
$
2,057
2.7
%
9.8
Health Care
5,158
17.3
%
1,646
5,031
17.0
1,489
2.5
%
10.6
Consumer and Office
4,316
14.4
%
930
4,153
14.0
840
3.9
%
10.8
Safety, Security and
Protection Services
3,802
12.7
%
847
3,821
12.9
814
(0.5)
%
4.1
Display and Graphics
3,560
11.9
%
693
3,674
12.4
788
(3.1)
%
(12.1)
Electro and Communications
3,228
10.8
%
691
3,306
11.2
712
(2.4)
%
(2.8)
Corporate and Unallocated
5
―
%
(469)
11
―
(421)
―
―
Elimination of Dual Credit
(511)
(1.7)
%
(113)
(458)
(1.5)
(101)
―
―
Total Company
$
29,904
100.0
%
$
6,483
$
29,611
100.0
$
6,178
1.0
%
4.9
Sales in 2012 increased 1.0 percent, led by Consumer and Office at 3.9 percent, Industrial and Transportation at 2.7
percent and Health Care at 2.5 percent. Sales declined 0.5 percent in Safety, Security and Protection Services, 2.4
percent in Electro and Communications and 3.1 percent in Display and Graphics. Total company organic local-currency
sales growth (which includes organic volume and selling price impacts) was 2.6 percent, acquisitions added 0.8 percent,
and foreign currency impacts reduced sales by 2.4 percent. Five of 3M’s six business segments posted operating income
margins in excess of 21 percent in 2012. Worldwide operating income margins for 2012 were 21.7 percent, compared to
20.9 percent for 2011.
Sales in 2011 increased 11.1 percent, led by Industrial and Transportation at 19.5 percent, Safety, Security and Protection
Services at 15.2 percent, and Health Care at 11.5 percent. Electro and Communications sales increased 8.6 percent and
Consumer and Office sales increased 7.8 percent. Sales declined 5.4 percent in Display and Graphics, due to fewer
orders for optical films. Total company organic local-currency sales growth was 4.7 percent, acquisitions added 3.3
percent, and foreign currency impacts added 3.1 percent. 3M’s six business segments all posted operating income
margins in excess of 20 percent in 2011 and 2010. Worldwide operating income margins for 2011 were 20.9 percent,
compared to 22.2 percent for 2010.
3M generated $5.3 billion of operating cash flow in 2012, an increase of $16 million when compared to 2011. This
followed an increase of $110 million when comparing 2011 to 2010. Refer to the section entitled “Financial Condition and
Liquidity” later in MD&A for a discussion of items impacting cash flows. In February 2013, 3M’s Board of Directors
authorized the repurchase of up to $7.5 billion of 3M’s outstanding common stock, which replaced the Company’s
previous repurchase program. This new program has no pre-established end date. In 2012, the Company purchased
$2.204 billion of treasury stock, compared to $2.701 billion in 2011 and $854 million in 2010. In February 2013, 3M’s
Board of Directors authorized a dividend increase of 7.6 percent for 2013, marking the 55th consecutive year of dividend
increases for 3M. 3M’s debt to total capital ratio (total capital defined as debt plus equity) was 25 percent at December 31,
2012, 2011 and 2010. 3M has an AA- credit rating with a stable outlook from Standard & Poor’s and an Aa2 credit rating
with a stable outlook from Moody’s Investors Service. The Company has significant cash on hand and sufficient additional
access to capital markets to meet its funding needs.
In 2012, the Company experienced stable to declining cost for most raw material categories and transportation fuel costs.
This was driven by year-on-year cost decreases in many feedstock categories, including petroleum based materials,
%
%
%
%
%
%
%
%
%
%
%
%
%
%
%
%