3M 2012 Annual Report Download - page 18
Download and view the complete annual report
Please find page 18 of the 2012 3M annual report below. You can navigate through the pages in the report by either clicking on the pages listed below, or by using the keyword search tool below to find specific information within the annual report.-
 1
1 -
2
-
3
-
4
-
5
-
6
-
7
-
 8
8 -
 9
9 -
 10
10 -
 11
11 -
 12
12 -
 13
13 -
 14
14 -
 15
15 -
 16
16 -
 17
17 -
 18
18 -
 19
19 -
 20
20 -
 21
21 -
 22
22 -
 23
23 -
 24
24 -
 25
25 -
 26
26 -
 27
27 -
 28
28 -
29
-
30
-
31
-
32
-
33
-
34
-
35
-
36
-
37
-
38
-
39
-
40
-
41
-
42
-
43
-
44
-
45
-
46
-
47
-
48
-
49
-
50
-
51
-
52
-
53
-
54
-
55
-
56
-
57
-
58
-
59
-
60
-
61
-
62
-
63
-
64
-
65
-
66
-
67
-
68
-
69
-
70
-
71
-
72
-
73
-
74
-
75
-
76
-
77
-
78
-
79
-
80
-
81
-
82
-
83
-
84
-
85
-
86
-
87
-
88
-
89
-
90
-
91
-
92
-
93
-
94
-
95
-
96
-
97
-
98
-
99
-
100
-
101
-
102
-
103
-
104
-
105
-
106
-
107
-
108
-
109
-
110
-
111
-
112
-
113
-
114
-
115
-
116
-
117
-
118
-
119
-
120
-
121
-
122
-
123
-
124
-
125
-
126
-
127
-
128
-
129
-
130
-
131
-
132
 |
 |

12
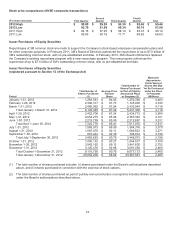
Stock price comparisons (NYSE composite transactions)
First Quarter
Second
Quarter
Third Quarter
Fourth
Quarter
Total
(Per share amounts)
2012 High
$
90.00
$
89.95
$
94.30
$
95.46
$
95.46
2012 Low
82.70
81.99
85.34
86.74
81.99
2011 High
$
94.16
$
97.95
$
98.19
$
83.10
$
98.19
2011 Low
85.63
90.19
71.71
68.63
68.63
Issuer Purchases of Equity Securities
Repurchases of 3M common stock are made to support the Company’s stock-based employee compensation plans and
for other corporate purposes. In February 2011, 3M’s Board of Directors authorized the repurchase of up to $7.0 billion of
3M’s outstanding common stock, with no pre-established end date. In February 2013, 3M’s Board of Directors replaced
the Company’s existing repurchase program with a new repurchase program. This new program authorizes the
repurchase of up to $7.5 billion of 3M’s outstanding common stock, with no pre-established end date.
Issuer Purchases of Equity Securities
(registered pursuant to Section 12 of the Exchange Act)
Period
Total Number of
Shares Purchased
(1)
Average Price
Paid per
Share
Total Number of
Shares Purchased
as Part of Publicly
Announced Plans
or Programs (2)
Maximum
Approximate
Dollar Value of
Shares that May
Yet Be Purchased
under the Plans
or Programs
(Millions)
January 1-31, 2012
1,263,561
$
84.83
1,252,356
$
4,483
February 1-29, 2012
2,396,317
$
87.73
1,745,000
$
4,330
March 1-31, 2012
2,466,062
$
87.94
2,433,944
$
4,116
Total January 1-March 31, 2012
6,125,940
$
87.22
5,431,300
$
4,116
April 1-30, 2012
2,452,708
$
87.24
2,434,773
$
3,904
May 1-31, 2012
2,654,275
$
85.98
2,363,345
$
3,701
June 1-30, 2012
2,218,795
$
85.99
2,212,897
$
3,511
Total April 1-June 30, 2012
7,325,778
$
86.41
7,011,015
$
3,511
July 1-31, 2012
1,588,973
$
88.99
1,584,376
$
3,370
August 1-31, 2012
1,087,478
$
92.11
1,066,823
$
3,271
September 1-30, 2012
807,242
$
92.39
796,874
$
3,198
Total July 1-September 30, 2012
3,483,693
$
90.75
3,448,073
$
3,198
October 1-31, 2012
1,050,152
$
90.27
1,044,517
$
3,104
November 1-30, 2012
3,942,165
$
89.12
3,941,600
$
2,752
December 1-31, 2012
3,126,478
$
92.98
3,091,056
$
2,465
Total October 1-December 31, 2012
8,118,795
$
90.76
8,077,173
$
2,465
Total January 1-December 31, 2012
25,054,206
$
88.62
23,967,561
$
2,465
(1)
The total number of shares purchased includes: (i) shares purchased under the Board’s authorizations described
above, and (ii) shares purchased in connection with the exercise of stock options.
(2)
The total number of shares purchased as part of publicly announced plans or programs includes shares purchased
under the Board’s authorizations described above.