3M 2012 Annual Report Download - page 34
Download and view the complete annual report
Please find page 34 of the 2012 3M annual report below. You can navigate through the pages in the report by either clicking on the pages listed below, or by using the keyword search tool below to find specific information within the annual report.-
 1
1 -
2
-
3
-
4
-
5
-
6
-
7
-
8
-
9
-
10
-
11
-
12
-
13
-
14
-
15
-
16
-
17
-
18
-
19
-
20
-
21
-
22
-
23
-
 24
24 -
 25
25 -
 26
26 -
 27
27 -
 28
28 -
 29
29 -
 30
30 -
 31
31 -
 32
32 -
 33
33 -
 34
34 -
 35
35 -
 36
36 -
 37
37 -
 38
38 -
 39
39 -
 40
40 -
 41
41 -
 42
42 -
 43
43 -
 44
44 -
45
-
46
-
47
-
48
-
49
-
50
-
51
-
52
-
53
-
54
-
55
-
56
-
57
-
58
-
59
-
60
-
61
-
62
-
63
-
64
-
65
-
66
-
67
-
68
-
69
-
70
-
71
-
72
-
73
-
74
-
75
-
76
-
77
-
78
-
79
-
80
-
81
-
82
-
83
-
84
-
85
-
86
-
87
-
88
-
89
-
90
-
91
-
92
-
93
-
94
-
95
-
96
-
97
-
98
-
99
-
100
-
101
-
102
-
103
-
104
-
105
-
106
-
107
-
108
-
109
-
110
-
111
-
112
-
113
-
114
-
115
-
116
-
117
-
118
-
119
-
120
-
121
-
122
-
123
-
124
-
125
-
126
-
127
-
128
-
129
-
130
-
131
-
132
 |
 |

28
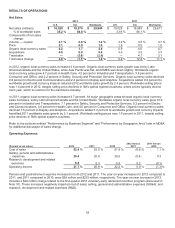
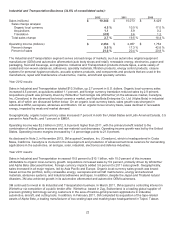
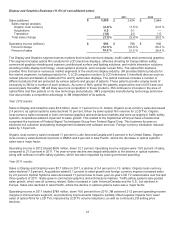
Electro and Communications Business (10.8% of consolidated sales):
2012
2011
2010
Sales (millions)
$
3,228
$
3,306
$
3,043
Sales change analysis:
Organic local currency
(0.8)
%
5.2
%
26.1
%
Acquisitions
―
0.1
―
Divestitures
―
―
(0.4)
Translation
(1.6)
3.3
1.8
Total sales change
(2.4)
%
8.6
%
27.5
%
Operating income (millions)
$
691
$
712
$
670
Percent change
(2.8)
%
6.2
%
90.6
%
Percent of sales
21.4
%
21.5
%
22.0
%
The Electro and Communications segment serves the electrical, electronics and communications industries, including
electrical utilities; electrical construction, maintenance and repair; original equipment manufacturer (OEM) electrical and
electronics; computers and peripherals; consumer electronics; telecommunications central office, outside plant and
enterprise; as well as aerospace, military, automotive and medical markets; with products that enable the efficient
transmission of electrical power and speed the delivery of information. Products include electronic and interconnect
solutions, micro interconnect systems, high-performance fluids, high-temperature and display tapes, telecommunications
products, electrical products, and touch screens and touch monitors.
Year 2012 results:
Electro and Communications sales totaled $3.2 billion, down 2.4 percent in U.S. dollars. Organic local-currency sales
declined 0.8 percent and foreign currency translation reduced sales by 1.6 percent. Organic local-currency sales declined
in the consumer electronics-related businesses and telecommunications markets business. Organic local-currency sales
increased in 3M’s touch systems and electrical markets businesses.
On a geographic basis, organic local-currency sales increased 12 percent in Latin America/Canada and 5 percent in the
United States. Organic local-currency sales declined 4 percent in both EMEA and Asia Pacific.
Operating income decreased 2.8 percent to $691 million in 2012. Operating income margins were 21.4 percent, similar to
the 21.5 percent operating income margins achieved in 2011.
Year 2011 results:
Electro and Communications sales were $3.3 billion in 2011, an increase of 8.6 percent in U.S. dollars. Organic local-
currency sales increased 5.2 percent and acquisitions added 0.1 percent to sales growth. Foreign currency impacts added
3.3 percent to 2011 sales growth. Sales expanded in all geographic regions, led by greater than 10 percent sales
increases in both Europe and Latin America/Canada. From a business standpoint, sales growth was led by 3M’s
electronics markets materials business and the electrical markets business. The telecom business also posted solid sales
growth, while sales declined in the electronic solutions business.
Operating income increased 6.2 percent to $712 million in 2011, driven by higher year-on-year sales growth. Operating
income margins were 21.5 percent, slightly lower than 2010.