3M 2012 Annual Report Download - page 5
Download and view the complete annual report
Please find page 5 of the 2012 3M annual report below. You can navigate through the pages in the report by either clicking on the pages listed below, or by using the keyword search tool below to find specific information within the annual report.-
 1
1 -
 2
2 -
 3
3 -
 4
4 -
 5
5 -
 6
6 -
 7
7 -
 8
8 -
 9
9 -
 10
10 -
 11
11 -
 12
12 -
 13
13 -
 14
14 -
 15
15 -
 16
16 -
17
-
18
-
19
-
20
-
21
-
22
-
23
-
24
-
25
-
26
-
27
-
28
-
29
-
30
-
31
-
32
-
33
-
34
-
35
-
36
-
37
-
38
-
39
-
40
-
41
-
42
-
43
-
44
-
45
-
46
-
47
-
48
-
49
-
50
-
51
-
52
-
53
-
54
-
55
-
56
-
57
-
58
-
59
-
60
-
61
-
62
-
63
-
64
-
65
-
66
-
67
-
68
-
69
-
70
-
71
-
72
-
73
-
74
-
75
-
76
-
77
-
78
-
79
-
80
-
81
-
82
-
83
-
84
-
85
-
86
-
87
-
88
-
89
-
90
-
91
-
92
-
93
-
94
-
95
-
96
-
97
-
98
-
99
-
100
-
101
-
102
-
103
-
104
-
105
-
106
-
107
-
108
-
109
-
110
-
111
-
112
-
113
-
114
-
115
-
116
-
117
-
118
-
119
-
120
-
121
-
122
-
123
-
124
-
125
-
126
-
127
-
128
-
129
-
130
-
131
-
132
 |
 |

3
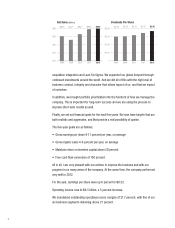
Sales for the year were nearly $30 billion. In organic local currency terms, sales
increased 2.6 percent, with particular strength in Latin America/Canada which was up
11 percent, and the United States, which was up 4 percent for the year.
Asia Pacific was flat for the year in organic local currency, impacted heavily by a soft
global consumer electronics industry. Europe/Middle East/Africa was down 1 percent.
Currency impacts reduced worldwide sales by 2.4 percent … and acquisitions added
nearly a point.
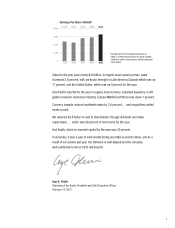
We returned $3.8 billion in cash to shareholders through dividends and share
repurchases … which was 86 percent of net income for the year.
And finally, return on invested capital for the year was 20 percent.
In summary, it was a year of solid results during uncertain economic times, and as a
result of our actions last year, the 3M team is well-aligned and the company
well-positioned to win in 2013 and beyond.
Inge G. Thulin
Chairman of the Board, President and Chief Executive Officer
February 14, 2013
$6.00
$4.00
$2.00
0
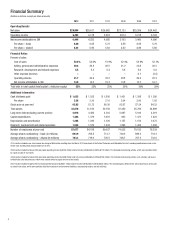
Earnings Per Share–Diluted*
2011
2008 2009 2010 2012
$8.00 $5.96
$4.89 $4.52 $5.63 $6.32
* As indicated in the Financial Summary on
page 4, certain years include net gains (losses)
related to sales of businesses, restructuring and
other items.