3M 2012 Annual Report Download - page 35
Download and view the complete annual report
Please find page 35 of the 2012 3M annual report below. You can navigate through the pages in the report by either clicking on the pages listed below, or by using the keyword search tool below to find specific information within the annual report.-
 1
1 -
2
-
3
-
4
-
5
-
6
-
7
-
8
-
9
-
10
-
11
-
12
-
13
-
14
-
15
-
16
-
17
-
18
-
19
-
20
-
21
-
22
-
23
-
24
-
 25
25 -
 26
26 -
 27
27 -
 28
28 -
 29
29 -
 30
30 -
 31
31 -
 32
32 -
 33
33 -
 34
34 -
 35
35 -
 36
36 -
 37
37 -
 38
38 -
 39
39 -
 40
40 -
 41
41 -
 42
42 -
 43
43 -
 44
44 -
 45
45 -
46
-
47
-
48
-
49
-
50
-
51
-
52
-
53
-
54
-
55
-
56
-
57
-
58
-
59
-
60
-
61
-
62
-
63
-
64
-
65
-
66
-
67
-
68
-
69
-
70
-
71
-
72
-
73
-
74
-
75
-
76
-
77
-
78
-
79
-
80
-
81
-
82
-
83
-
84
-
85
-
86
-
87
-
88
-
89
-
90
-
91
-
92
-
93
-
94
-
95
-
96
-
97
-
98
-
99
-
100
-
101
-
102
-
103
-
104
-
105
-
106
-
107
-
108
-
109
-
110
-
111
-
112
-
113
-
114
-
115
-
116
-
117
-
118
-
119
-
120
-
121
-
122
-
123
-
124
-
125
-
126
-
127
-
128
-
129
-
130
-
131
-
132
 |
 |

29
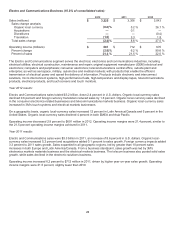
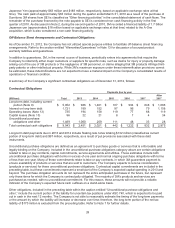
PERFORMANCE BY GEOGRAPHIC AREA
While 3M manages its businesses globally and believes its business segment results are the most relevant measure of
performance, the Company also utilizes geographic area data as a secondary performance measure. Export sales are
generally reported within the geographic area where the final sales to 3M customers are made. A portion of the products
or components sold by 3M’s operations to its customers are exported by these customers to different geographic areas.
As customers move their operations from one geographic area to another, 3M’s results will follow. Thus, net sales in a
particular geographic area are not indicative of end-user consumption in that geographic area. Financial information
related to 3M operations in various geographic areas is provided in Note 16.
A summary of key information and discussion related to 3M’s geographic areas follow:
2012
United
States
Asia
Pacific
Europe,
Middle East
& Africa
Latin
America/
Canada
Other
Unallocated
Worldwide
Net sales (millions)
$
10,528
$
9,092
$
6,730
$
3,572
$
(18)
$
29,904
% of worldwide sales
35.2
%
30.4
%
22.5
%
11.9
%
―
100.0
%
Components of net sales change:
Volume — organic
2.1
%
1.3
%
(2.8)
%
6.9
%
―
1.2
%
Price
2.1
(1.2)
2.2
4.0
―
1.4
Organic local-currency sales
4.2
0.1
(0.6)
10.9
―
2.6
Acquisitions
0.8
0.3
1.9
0.1
―
0.8
Translation
―
(0.6)
(6.2)
(6.3)
―
(2.4)
Total sales change
5.0
%
(0.2)
%
(4.9)
%
4.7
%
―
1.0
%
Operating income (millions)
$
1,929
$
2,450
$
1,163
$
945
$
(4)
$
6,483
Percent change
18.4
%
(2.9)
%
1.2
%
5.5
%
―
4.9
%
For total year 2012, as shown in the preceding table, sales rose 1.0 percent, with organic volume increases of 1.2 percent
and selling price increases of 1.4 percent. Acquisitions added 0.8 percent, while foreign currency effects reduced sales by
2.4 percent. Organic local-currency sales growth was led by Latin America/Canada at 10.9 percent and the United
States at 4.2 percent. Organic local-currency sales increased in Asia Pacific by 0.1 percent and declined in EMEA by 0.6
percent. For 2012, international operations represented 64.8 percent of 3M’s sales.
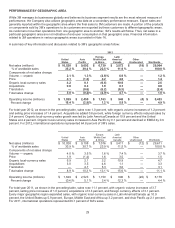
2011
United
States
Asia
Pacific
Europe,
Middle East
& Africa
Latin
America/
Canada
Other
Unallocated
Worldwide
Net sales (millions)
$
10,028
$
9,108
$
7,076
$
3,411
$
(12)
$
29,611
% of worldwide sales
33.9
%
30.7
%
23.9
%
11.5
%
―
100.0
%
Components of net sales change:
Volume — organic
4.0
%
3.5
%
1.6
%
7.4
%
―
3.7
%
Price
1.9
(1.4)
1.6
3.5
―
1.0
Organic local-currency sales
5.9
2.1
3.2
10.9
―
4.7
Acquisitions
3.0
3.5
4.6
1.1
―
3.3
Translation
―
4.7
5.3
3.6
―
3.1
Total sales change
8.9
%
10.3
%
13.1
%
15.6
%
―
11.1
%
Operating income (millions)
$
1,629
$
2,523
$
1,150
$
896
$
(20)
$
6,178
Percent change
(0.4)
%
5.1
%
3.4
%
12.3
%
―
4.4
%
For total year 2011, as shown in the preceding table, sales rose 11.1 percent, with organic volume increases of 3.7
percent, selling price increases of 1.0 percent, acquisitions of 3.3 percent, and foreign currency effects of 3.1 percent.
Every major geographic region expanded sales, with organic local-currency sales in Latin America/Canada up 10.9
percent, the United States up 5.9 percent, Europe, Middle East and Africa up 3.2 percent, and Asia Pacific up 2.1 percent.
For 2011, international operations represented 66.1 percent of 3M’s sales.