3M 2012 Annual Report Download - page 42
Download and view the complete annual report
Please find page 42 of the 2012 3M annual report below. You can navigate through the pages in the report by either clicking on the pages listed below, or by using the keyword search tool below to find specific information within the annual report.-
 1
1 -
2
-
3
-
4
-
5
-
6
-
7
-
8
-
9
-
10
-
11
-
12
-
13
-
14
-
15
-
16
-
17
-
18
-
19
-
20
-
21
-
22
-
23
-
24
-
25
-
26
-
27
-
28
-
29
-
30
-
31
-
 32
32 -
 33
33 -
 34
34 -
 35
35 -
 36
36 -
 37
37 -
 38
38 -
 39
39 -
 40
40 -
 41
41 -
 42
42 -
 43
43 -
 44
44 -
 45
45 -
 46
46 -
 47
47 -
 48
48 -
 49
49 -
 50
50 -
 51
51 -
 52
52 -
53
-
54
-
55
-
56
-
57
-
58
-
59
-
60
-
61
-
62
-
63
-
64
-
65
-
66
-
67
-
68
-
69
-
70
-
71
-
72
-
73
-
74
-
75
-
76
-
77
-
78
-
79
-
80
-
81
-
82
-
83
-
84
-
85
-
86
-
87
-
88
-
89
-
90
-
91
-
92
-
93
-
94
-
95
-
96
-
97
-
98
-
99
-
100
-
101
-
102
-
103
-
104
-
105
-
106
-
107
-
108
-
109
-
110
-
111
-
112
-
113
-
114
-
115
-
116
-
117
-
118
-
119
-
120
-
121
-
122
-
123
-
124
-
125
-
126
-
127
-
128
-
129
-
130
-
131
-
132
 |
 |

36
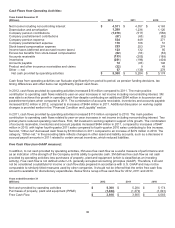
Cash Flows from Operating Activities:
Years Ended December 31
(Millions)
2012
2011
2010
Net income including noncontrolling interest
$
4,511
$
4,357
$
4,163
Depreciation and amortization
1,288
1,236
1,120
Company pension contributions
(1,079)
(517)
(556)
Company postretirement contributions
(67)
(65)
(62)
Company pension expense
534
449
271
Company postretirement expense
116
106
51
Stock-based compensation expense
223
253
274
Income taxes (deferred and accrued income taxes)
123
132
85
Excess tax benefits from stock-based compensation
(62)
(53)
(53)
Accounts receivable
(133)
(205)
(189)
Inventories
(251)
(196)
(404)
Accounts payable
72
(83)
146
Product and other insurance receivables and claims
(32)
9
49
Other — net
57
(139)
279
Net cash provided by operating activities
$
5,300
$
5,284
$
5,174
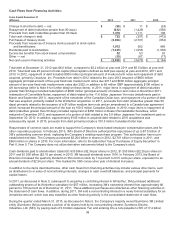
Cash flows from operating activities can fluctuate significantly from period to period, as pension funding decisions, tax
timing differences and other items can significantly impact cash flows.
In 2012, cash flows provided by operating activities increased $16 million compared to 2011. The main positive
contribution to operating cash flows related to year-on-year increases in net income including noncontrolling interest. 3M
was able to achieve this growth in operating cash flow despite contributing an additional $564 million in its pension and
postretirement plans when compared to 2011. The combination of accounts receivable, inventories and accounts payable
increased $312 million in 2012, compared to increases of $484 million in 2011. Additional discussion on working capital
changes is provided earlier in the “Financial Condition and Liquidity” section.
In 2011, cash flows provided by operating activities increased $110 million compared to 2010. The main positive
contribution to operating cash flows related to year-on-year increases in net income including noncontrolling interest. Two
primary items reduced operating cash flows. First, 3M invested in working capital in support of its growth. The combination
of accounts receivable, inventories and account payable increased $484 million in 2011, compared to increases of $447
million in 2010, with higher fourth-quarter 2011 sales compared to fourth-quarter 2010 sales contributing to this increase.
Second, “Other-net” decreased cash flows by $139 million in 2011 compared to an increase of $279 million in 2010. The
category, “Other-net,” in the preceding table reflects changes in other asset and liability accounts, such as a decrease in
accrued payroll amounts in 2011 related to certain annual incentives, which reduced liabilities.
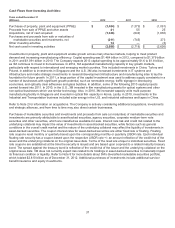
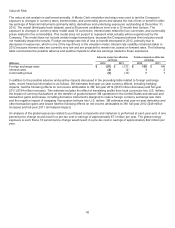
Free Cash Flow (non-GAAP measure):
In addition, to net cash provided by operating activities, 3M uses free cash flow as a useful measure of performance and
as an indication of the strength of the Company and its ability to generate cash. 3M defines free cash flow as net cash
provided by operating activities less purchases of property, plant and equipment (which is classified as an investing
activity). Free cash flow is not defined under U.S. generally accepted accounting principles (GAAP). Therefore, it should
not be considered a substitute for income or cash flow data prepared in accordance with U.S. GAAP and may not be
comparable to similarly titled measures used by other companies. It should not be inferred that the entire free cash flow
amount is available for discretionary expenditures. Below find a recap of free cash flow for 2012, 2011 and 2010.
Years ended December 31
(Millions)
2012
2011
2010
Net cash provided by operating activities
$
5,300
$
5,284
$
5,174
Purchases of property, plant and equipment (PP&E)
(1,484)
(1,379)
(1,091)
Free Cash Flow
$
3,816
$
3,905
$
4,083