3M 2012 Annual Report Download - page 43
Download and view the complete annual report
Please find page 43 of the 2012 3M annual report below. You can navigate through the pages in the report by either clicking on the pages listed below, or by using the keyword search tool below to find specific information within the annual report.-
 1
1 -
2
-
3
-
4
-
5
-
6
-
7
-
8
-
9
-
10
-
11
-
12
-
13
-
14
-
15
-
16
-
17
-
18
-
19
-
20
-
21
-
22
-
23
-
24
-
25
-
26
-
27
-
28
-
29
-
30
-
31
-
32
-
 33
33 -
 34
34 -
 35
35 -
 36
36 -
 37
37 -
 38
38 -
 39
39 -
 40
40 -
 41
41 -
 42
42 -
 43
43 -
 44
44 -
 45
45 -
 46
46 -
 47
47 -
 48
48 -
 49
49 -
 50
50 -
 51
51 -
 52
52 -
 53
53 -
54
-
55
-
56
-
57
-
58
-
59
-
60
-
61
-
62
-
63
-
64
-
65
-
66
-
67
-
68
-
69
-
70
-
71
-
72
-
73
-
74
-
75
-
76
-
77
-
78
-
79
-
80
-
81
-
82
-
83
-
84
-
85
-
86
-
87
-
88
-
89
-
90
-
91
-
92
-
93
-
94
-
95
-
96
-
97
-
98
-
99
-
100
-
101
-
102
-
103
-
104
-
105
-
106
-
107
-
108
-
109
-
110
-
111
-
112
-
113
-
114
-
115
-
116
-
117
-
118
-
119
-
120
-
121
-
122
-
123
-
124
-
125
-
126
-
127
-
128
-
129
-
130
-
131
-
132
 |
 |

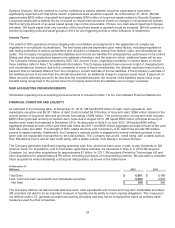
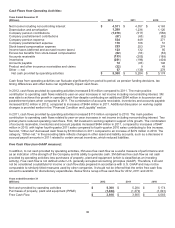
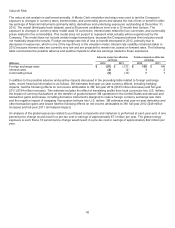
37
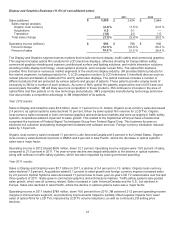
Cash Flows from Investing Activities:
Years ended December 31
(Millions)
2012
2011
2010
Purchases of property, plant and equipment (PP&E)
$
(1,484)
$
(1,379)
$
(1,091)
Proceeds from sale of PP&E and other assets
41
55
25
Acquisitions, net of cash acquired
(1,046)
(649)
(1,830)
Purchases and proceeds from sale or maturities of
marketable securities and investments, net
(211)
(745)
273
Other investing activities
14
―
(3)
Net cash used in investing activities
$
(2,686)
$
(2,718)
$
(2,626)
Investments in property, plant and equipment enable growth across many diverse markets, helping to meet product
demand and increasing manufacturing efficiency. Capital spending was $1.484 billion in 2012, compared to $1.379 billion
in 2011 and $1.091 billion in 2010. The Company expects 2013 capital spending to be approximately $1.6 to $1.8 billion,
as 3M continues to invest in its businesses. In 2012, 3M expanded manufacturing capacity in key growth markets,
particularly with respect to international and emerging market countries. This included investments in China, Turkey and
Poland, in addition to investments in Singapore and the U.S. 3M also increased investments in IT systems and
infrastructure and made strategic investments in research/development infrastructure and manufacturing sites to lay the
foundation for future growth. In 2011, a large portion of the capital investment was used to address supply constraints in a
number of businesses with significant growth potential, such as renewable energy, traffic signage in developing
economies, and optically clear adhesives and glass bubbles. In addition, some of the following 2010 capital projects
carried forward into 2011. In 2010, in the U.S., 3M invested in film manufacturing assets for optical systems and other
non-optical businesses which use similar technology. Also, in 2010, 3M increased capacity at its multi-purpose
manufacturing facility in Singapore and invested in optical film capacity in Korea. Lastly, in 2010, investments in the
Industrial and Transportation business included solar energy in the U.S. and industrial adhesives and tapes in China.
Refer to Note 2 for information on acquisitions. The Company is actively considering additional acquisitions, investments
and strategic alliances, and from time to time may also divest certain businesses.
Purchases of marketable securities and investments and proceeds from sale (or maturities) of marketable securities and
investments are primarily attributable to asset-backed securities, agency securities, corporate medium-term note
securities and other securities, which are classified as available-for-sale. Interest rate risk and credit risk related to the
underlying collateral may impact the value of investments in asset-backed securities, while factors such as general
conditions in the overall credit market and the nature of the underlying collateral may affect the liquidity of investments in
asset-backed securities. The coupon interest rates for asset-backed securities are either fixed rate or floating. Floating
rate coupons reset monthly or quarterly based upon the corresponding monthly or quarterly LIBOR rate. Each individual
floating rate security has a coupon based upon the respective LIBOR rate +/- an amount reflective of the credit risk of the
issuer and the underlying collateral on the original issue date. Terms of the reset are unique to individual securities. Fixed
rate coupons are established at the time the security is issued and are based upon a spread to a related maturity treasury
bond. The spread against the treasury bond is reflective of the credit risk of the issuer and the underlying collateral on the
original issue date. 3M does not currently expect risk related to its holdings in asset-backed securities to materially impact
its financial condition or liquidity. Refer to Note 8 for more details about 3M’s diversified marketable securities portfolio,
which totaled $2.810 billion as of December 31, 2012. Additional purchases of investments include additional survivor
benefit insurance and equity investments.
37
―