3M 2012 Annual Report Download - page 44
Download and view the complete annual report
Please find page 44 of the 2012 3M annual report below. You can navigate through the pages in the report by either clicking on the pages listed below, or by using the keyword search tool below to find specific information within the annual report.-
 1
1 -
2
-
3
-
4
-
5
-
6
-
7
-
8
-
9
-
10
-
11
-
12
-
13
-
14
-
15
-
16
-
17
-
18
-
19
-
20
-
21
-
22
-
23
-
24
-
25
-
26
-
27
-
28
-
29
-
30
-
31
-
32
-
33
-
 34
34 -
 35
35 -
 36
36 -
 37
37 -
 38
38 -
 39
39 -
 40
40 -
 41
41 -
 42
42 -
 43
43 -
 44
44 -
 45
45 -
 46
46 -
 47
47 -
 48
48 -
 49
49 -
 50
50 -
 51
51 -
 52
52 -
 53
53 -
 54
54 -
55
-
56
-
57
-
58
-
59
-
60
-
61
-
62
-
63
-
64
-
65
-
66
-
67
-
68
-
69
-
70
-
71
-
72
-
73
-
74
-
75
-
76
-
77
-
78
-
79
-
80
-
81
-
82
-
83
-
84
-
85
-
86
-
87
-
88
-
89
-
90
-
91
-
92
-
93
-
94
-
95
-
96
-
97
-
98
-
99
-
100
-
101
-
102
-
103
-
104
-
105
-
106
-
107
-
108
-
109
-
110
-
111
-
112
-
113
-
114
-
115
-
116
-
117
-
118
-
119
-
120
-
121
-
122
-
123
-
124
-
125
-
126
-
127
-
128
-
129
-
130
-
131
-
132
 |
 |

38
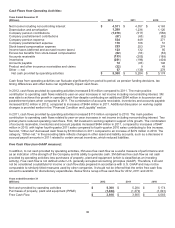
Cash Flows from Financing Activities:
Years Ended December 31
(Millions)
2012
2011
2010
Change in short-term debt — net
$
(36)
$
11
$
(24)
Repayment of debt (maturities greater than 90 days)
(612)
(1,429)
(556)
Proceeds from debt (maturities greater than 90 days)
1,370
1,111
108
Total cash change in debt
$
722
$
(307)
$
(472)
Purchases of treasury stock
(2,204)
(2,701)
(854)
Proceeds from issuances of treasury stock pursuant to stock option
and benefit plans
1,012
902
666
Dividends paid to stockholders
(1,635)
(1,555)
(1,500)
Excess tax benefits from stock-based compensation
62
53
53
Other — net
(15)
(67)
(77)
Net cash used in financing activities
$
(2,058)
$
(3,675)
$
(2,184)
Total debt at December 31, 2012 was $6.0 billion, compared to $5.2 billion at year-end 2011 and $5.5 billion at year-end
2010. Total debt was 25 percent of total capital (total capital is defined as debt plus equity) at year-end 2012, 2011 and
2010. In 2012, repayment of debt included $500 million (principal amount) of medium-term notes and repayment of debt
acquired, primarily Ceradyne, Inc. Proceeds from debt in 2012 related to the June 2012 issuance of $650 million
aggregate principal amount of five-year fixed rate medium-term notes due 2017 and $600 million aggregate principal
amount of ten-year fixed rate medium-term notes due 2022, in addition to 66 million GBP (approximately $106 million) in
UK borrowings (refer to Note 9 for further detail on these items). In 2011, major items in repayment of debt (maturities
greater than 90 days) included redemption of $800 million (principal amount) of medium-term notes in November 2011,
redemption of Convertible Notes, repayment of debt related to the 11.6 billion Japanese Yen note (installments paid in
March and September 2011), repayment of the remainder of the Canadian Dollar loan, and repayment of a portion of debt
that was acquired, primarily related to the Winterthur acquisition. In 2011, proceeds from debt (maturities greater than 90
days) primarily related to the issuance of a $1 billion medium term note and an amendment to a Canada loan agreement
which increased the principal amount of the loan by 100.5 million Canadian Dollars. In 2010, major items in repayment of
debt (maturities greater than 90 days) included repayment of $350 million in Dealer Remarketable Securities, which
matured in December 2010, and repayment of a portion of debt related to the 5.8 billion Japanese Yen installment paid on
September 30, 2010. In addition, approximately $105 million in acquired debt related to 2010 acquisitions was
subsequently repaid. In 2010, proceeds from debt primarily include a 100.5 million Canadian Dollar loan.
Repurchases of common stock are made to support the Company’s stock-based employee compensation plans and for
other corporate purposes. In February 2013, 3M’s Board of Directors authorized the repurchase of up to $7.5 billion of
3M’s outstanding common stock, replacing the Company’s existing repurchase program. This authorization has no pre-
established end date. The Company purchased $2.204 billion in shares in 2012, $2.701 billion in shares in 2011, and
$854 million in shares in 2010. For more information, refer to the table titled “Issuer Purchases of Equity Securities” in
Part II, Item 5. The Company does not utilize derivative instruments linked to the Company’s stock.
Cash dividends paid to shareholders totaled $1.635 billion ($2.36 per share) in 2012, $1.555 billion ($2.20 per share) in
2011 and $1.500 billion ($2.10 per share) in 2010. 3M has paid dividends since 1916. In February 2013, the Board of
Directors increased the quarterly dividend on 3M common stock by 7.6 percent to 63.5 cents per share, equivalent to an
annual dividend of $2.54 per share. This marked the 55th consecutive year of dividend increases.
In addition to the items described below, other cash flows from financing activities may include various other items, such
as distributions to or sales of noncontrolling interests, changes in cash overdraft balances, and principal payments for
capital leases.
In 2011, as discussed in Note 5, subsequent to acquiring a controlling interest in Winterthur, 3M purchased additional
outstanding shares of its Winterthur subsidiary for $57 million, increasing 3M’s ownership interest from approximately 86
percent to 100 percent as of December 31, 2011. These additional purchases are reflected as other financing activities in
the statement of cash flows. In addition, during 2011, 3M sold a noncontrolling interest in a newly formed subsidiary for an
immaterial amount, which was also classified as other financing activity in the consolidated statement of cash flows.
During the quarter ended March 31, 2010, as discussed in Note 5, the Company’s majority owned Sumitomo 3M Limited
entity (Sumitomo 3M) purchased a portion of its shares held by its noncontrolling interest, Sumitomo Electric
Industries, Ltd. (SEI), by paying cash of 5.8 billion Japanese Yen and entering into a note payable to SEI of 17.4 billion