3M 2012 Annual Report Download - page 24
Download and view the complete annual report
Please find page 24 of the 2012 3M annual report below. You can navigate through the pages in the report by either clicking on the pages listed below, or by using the keyword search tool below to find specific information within the annual report.-
 1
1 -
2
-
3
-
4
-
5
-
6
-
7
-
8
-
9
-
10
-
11
-
12
-
13
-
 14
14 -
 15
15 -
 16
16 -
 17
17 -
 18
18 -
 19
19 -
 20
20 -
 21
21 -
 22
22 -
 23
23 -
 24
24 -
 25
25 -
 26
26 -
 27
27 -
 28
28 -
 29
29 -
 30
30 -
 31
31 -
 32
32 -
 33
33 -
 34
34 -
35
-
36
-
37
-
38
-
39
-
40
-
41
-
42
-
43
-
44
-
45
-
46
-
47
-
48
-
49
-
50
-
51
-
52
-
53
-
54
-
55
-
56
-
57
-
58
-
59
-
60
-
61
-
62
-
63
-
64
-
65
-
66
-
67
-
68
-
69
-
70
-
71
-
72
-
73
-
74
-
75
-
76
-
77
-
78
-
79
-
80
-
81
-
82
-
83
-
84
-
85
-
86
-
87
-
88
-
89
-
90
-
91
-
92
-
93
-
94
-
95
-
96
-
97
-
98
-
99
-
100
-
101
-
102
-
103
-
104
-
105
-
106
-
107
-
108
-
109
-
110
-
111
-
112
-
113
-
114
-
115
-
116
-
117
-
118
-
119
-
120
-
121
-
122
-
123
-
124
-
125
-
126
-
127
-
128
-
129
-
130
-
131
-
132
 |
 |

18
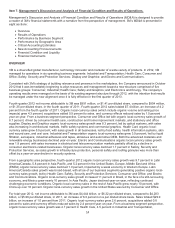
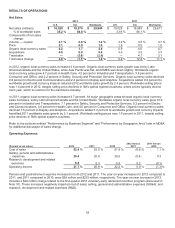
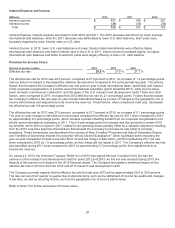
RESULTS OF OPERATIONS
Net Sales:
2012
2011
U.S.
Intl.
Worldwide
U.S.
Intl.
Worldwide
Net sales (millions)
$
10,528
$
19,376
$
29,904
$
10,028
$
19,583
$
29,611
% of worldwide sales
35.2
%
64.8
%
33.9
%
66.1
%
Components of net sales
change:
Volume — organic
2.1
%
0.8
%
1.2
%
4.0
%
3.5
%
3.7
%
Price
2.1
0.9
1.4
1.9
0.5
1.0
Organic local-currency sales
4.2
1.7
2.6
5.9
4.0
4.7
Acquisitions
0.8
0.8
0.8
3.0
3.5
3.3
Translation
―
(3.6)
(2.4)
―
4.7
3.1
Total sales change
5.0
%
(1.1)
%
1.0
%
8.9
%
12.2
%
11.1
%
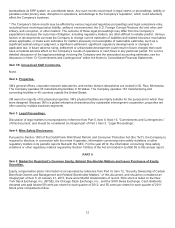
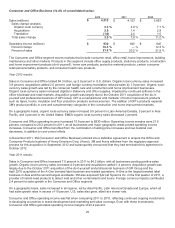
In 2012, organic local-currency sales increased 2.6 percent. Organic local-currency sales growth was led by Latin
America/Canada and the United States, while Asia Pacific was flat, and EMEA was down slightly. Worldwide organic
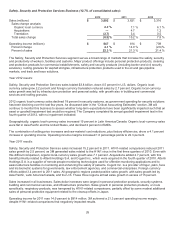
local-currency sales grew 4.7 percent in Health Care, 4.5 percent in Industrial and Transportation, 3.8 percent in
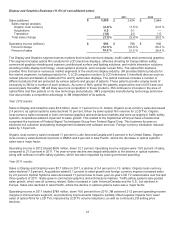
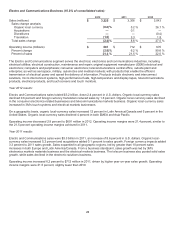
Consumer and Office, and 2.2 percent in Safety, Security and Protection Services. Organic local-currency sales declined
0.8 percent in Electro and Communications and 2.4 percent in Display and Graphics. Acquisitions added 0.8 percent to
worldwide growth and currency impacts reduced 2012 worldwide sales growth by 2.4 percent. Worldwide selling prices
rose 1.4 percent in 2012, despite selling price declines in 3M’s optical systems business, where prices typically decline
each year, which is common for the electronics industry.
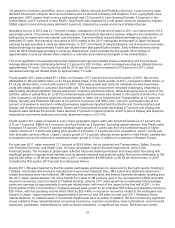
In 2011, organic local-currency sales increased 4.7 percent. All major geographic areas showed organic local-currency
sales increases, led by Latin America/Canada and the United States. Worldwide organic local-currency sales grew 10.0
percent in Industrial and Transportation, 7.1 percent in Safety, Security and Protection Services, 5.2 percent in Electro
and Communications, 4.6 percent in Health Care, and 4.0 percent in Consumer and Office. Organic local-currency sales
declined 7.5 percent in Display and Graphics. Acquisitions added 3.3 percent to worldwide growth and currency impacts
benefited 2011 worldwide sales growth by 3.1 percent. Worldwide selling prices rose 1.0 percent in 2011, despite selling
price declines in 3M’s optical systems business.
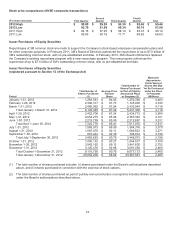
Refer to the sections entitled “Performance by Business Segment” and “Performance by Geographic Area” later in MD&A
for additional discussion of sales change.
Operating Expenses:
2012 Versus
2011
2011 Versus
2010
(Percent of net sales)
2012
2011
2010
Cost of sales
52.4
%
53.0
%
51.9
%
(0.6)
%
1.1
%
Selling, general and administrative
20.4
20.8
20.5
(0.4)
0.3
expenses
Research, development and related
5.5
5.3
5.4
0.2
(0.1)
expenses
Operating income
21.7
%
20.9
%
22.2
%
0.8
%
(1.3)
%
Pension and postretirement expense increased in both 2012 and 2011. The year-on-year increases for 2012 compared to
2011, and 2011 compared to 2010, were $95 million and $233 million, respectively. The year-on-year increase in 2012
includes a $26 million charge related to the first-quarter 2012 voluntary early retirement incentive program (discussed in
Note 10). These increases negatively impacted cost of sales; selling, general and administrative expenses (SG&A); and
research, development and related expenses (R&D).