3M 2012 Annual Report Download - page 25
Download and view the complete annual report
Please find page 25 of the 2012 3M annual report below. You can navigate through the pages in the report by either clicking on the pages listed below, or by using the keyword search tool below to find specific information within the annual report.-
 1
1 -
2
-
3
-
4
-
5
-
6
-
7
-
8
-
9
-
10
-
11
-
12
-
13
-
14
-
 15
15 -
 16
16 -
 17
17 -
 18
18 -
 19
19 -
 20
20 -
 21
21 -
 22
22 -
 23
23 -
 24
24 -
 25
25 -
 26
26 -
 27
27 -
 28
28 -
 29
29 -
 30
30 -
 31
31 -
 32
32 -
 33
33 -
 34
34 -
 35
35 -
36
-
37
-
38
-
39
-
40
-
41
-
42
-
43
-
44
-
45
-
46
-
47
-
48
-
49
-
50
-
51
-
52
-
53
-
54
-
55
-
56
-
57
-
58
-
59
-
60
-
61
-
62
-
63
-
64
-
65
-
66
-
67
-
68
-
69
-
70
-
71
-
72
-
73
-
74
-
75
-
76
-
77
-
78
-
79
-
80
-
81
-
82
-
83
-
84
-
85
-
86
-
87
-
88
-
89
-
90
-
91
-
92
-
93
-
94
-
95
-
96
-
97
-
98
-
99
-
100
-
101
-
102
-
103
-
104
-
105
-
106
-
107
-
108
-
109
-
110
-
111
-
112
-
113
-
114
-
115
-
116
-
117
-
118
-
119
-
120
-
121
-
122
-
123
-
124
-
125
-
126
-
127
-
128
-
129
-
130
-
131
-
132
 |
 |
19
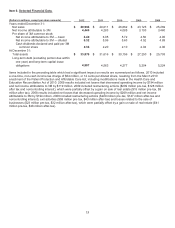
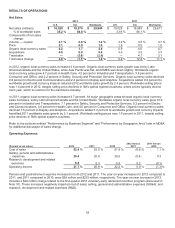
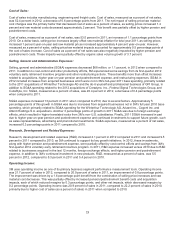
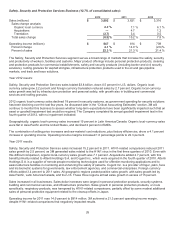
Cost of Sales:
Cost of sales includes manufacturing, engineering and freight costs. Cost of sales, measured as a percent of net sales,
was 52.4 percent in 2012, a decrease of 0.6 percentage points from 2011. The net impact of selling price/raw material
cost changes was the primary factor that decreased cost of sales as a percent of sales, as selling prices increased 1.4
percent and raw material costs decreased approximately 2 percent. This benefit was partially offset by higher pension and
postretirement costs.
Cost of sales, measured as a percent of net sales, was 53.0 percent in 2011, an increase of 1.1 percentage points from
2010. On a dollar basis, selling price increases largely offset raw material inflation for total year 2011, as selling prices
increased 1 percent year-on-year and raw material prices increased approximately 4 percent year-on-year. However,
measured as a percent of sales, selling price/raw material impacts accounted for approximately 0.5 percentage points of
the cost of sales increase. Cost of sales as a percent of net sales was also negatively impacted by higher pension and
postretirement costs. These impacts were partially offset by organic sales volume growth of 3.7 percent.
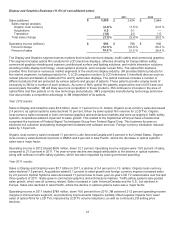
Selling, General and Administrative Expenses:
Selling, general and administrative (SG&A) expenses decreased $68 million, or 1.1 percent, in 2012 when compared to
2011. In addition to cost-control and other productivity efforts, 3M experienced some savings from its first-quarter 2012
voluntary early retirement incentive program and other restructuring actions. These benefits more than offset increases
related to acquisitions, higher year-on-year pension and postretirement expense, and restructuring expenses. SG&A in
2012 included increases from acquired businesses which were not in 3M’s full-year 2011 base spending, primarily related
to the 2011 acquisitions of Winterthur Technologie AG and the do-it-yourself and professional business of GPI Group, in
addition to SG&A spending related to the 2012 acquisitions of Ceradyne, Inc., Federal Signal Technologies Group, and
CodeRyte, Inc. SG&A, measured as a percent of sales, was 20.4 percent in 2012, a decrease of 0.4 percentage points
when compared to 2011.
SG&A expenses increased 13 percent in 2011 when compared to 2010, due to several factors. Approximately 5
percentage points of this growth in SG&A was due to increases from acquired businesses not in 3M’s full year 2010 base
spending, which primarily related to SG&A spending for the Winterthur Technologie AG, Arizant Inc., Cogent Inc. and
Attenti Holdings S.A. acquisitions. Another 3 percentage points of growth in 2011 SG&A was due to foreign exchange
effects, which resulted in higher translated costs from 3M’s non-U.S. subsidiaries. Finally, 2011 SG&A increased in part
due to higher year-on-year pension and postretirement expense and continued investments to support future growth, such
as sales representatives, advertising and promotional investments. SG&A expenses, measured as a percent of net sales,
increased 0.3 percentage points in 2011 compared to 2010.
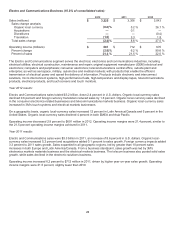
Research, Development and Related Expenses:
Research, development and related expenses (R&D) increased 4.1 percent in 2012 compared to 2011 and increased 9.5
percent in 2011 compared to 2010, as 3M continued to support its key growth initiatives. In 2012, these investments,
along with higher pension and postretirement expense, were partially offset by cost-control efforts and savings from 3M’s
first-quarter 2012 voluntary early retirement incentive program. In 2011, R&D expense increased versus 2010 due to R&D
related to businesses acquired in the last 12 months, foreign exchange effects, and higher pension and postretirement
expense, in addition to 3M’s continued investment in new products. R&D, measured as a percent of sales, was 5.5
percent in 2012, compared to 5.3 percent in 2011 and 5.4 percent in 2010.
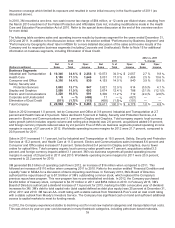
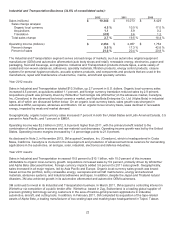
Operating Income:
3M uses operating income as one of its primary business segment performance measurement tools. Operating income
was 21.7 percent of sales in 2012, compared to 20.9 percent of sales in 2011, an improvement of 0.8 percentage points.
The improvement was driven by a 1.6 percentage point benefit from the combination of selling price increases and raw
material cost decreases. This was partially offset by increased pension/postretirement benefit costs and acquisition
impacts, each of which reduced margins by 0.3 percentage points, and other net impacts, which decreased margins by
0.2 percentage points. Operating income was 20.9 percent of sales in 2011, compared to 22.2 percent of sales in 2010,
primarily due to higher cost of sales (as a percent of sales) in 2011 when compared to 2010.