Xcel Energy 2007 Annual Report Download - page 38
Download and view the complete annual report
Please find page 38 of the 2007 Xcel Energy annual report below. You can navigate through the pages in the report by either clicking on the pages listed below, or by using the keyword search tool below to find specific information within the annual report.-
 1
1 -
2
-
3
-
4
-
5
-
6
-
7
-
8
-
9
-
10
-
11
-
12
-
13
-
14
-
15
-
16
-
17
-
18
-
19
-
20
-
21
-
22
-
23
-
24
-
25
-
26
-
27
-
 28
28 -
 29
29 -
 30
30 -
 31
31 -
 32
32 -
 33
33 -
 34
34 -
 35
35 -
 36
36 -
 37
37 -
 38
38 -
 39
39 -
 40
40 -
 41
41 -
 42
42 -
 43
43 -
 44
44 -
 45
45 -
 46
46 -
 47
47 -
 48
48 -
49
-
50
-
51
-
52
-
53
-
54
-
55
-
56
-
57
-
58
-
59
-
60
-
61
-
62
-
63
-
64
-
65
-
66
-
67
-
68
-
69
-
70
-
71
-
72
-
73
-
74
-
75
-
76
-
77
-
78
-
79
-
80
-
81
-
82
-
83
-
84
-
85
-
86
-
87
-
88
-
89
-
90
-
91
-
92
-
93
-
94
-
95
-
96
-
97
-
98
-
99
-
100
-
101
-
102
-
103
-
104
-
105
-
106
-
107
-
108
-
109
-
110
-
111
-
112
-
113
-
114
-
115
-
116
-
117
-
118
-
119
-
120
-
121
-
122
-
123
-
124
-
125
-
126
-
127
-
128
-
129
-
130
-
131
-
132
-
133
-
134
-
135
-
136
-
137
-
138
-
139
-
140
-
141
-
142
-
143
-
144
-
145
-
146
-
147
-
148
-
149
-
150
-
151
-
152
-
153
-
154
-
155
-
156
 |
 |

supplies on a peak day. The balance of the quantities required to meet firm peak day sales obligations are primarily
purchased at PSCo’s city gate meter stations and a small amount is received directly from wellhead sources.
PSCo is required by CPUC regulations to file a natural gas purchase plan by June of each year projecting and
describing the quantities of natural gas supplies, upstream services and the costs of those supplies and services for the
period beginning July 1 through June 30 of the following year. PSCo is also required to file a natural gas purchase
report by October of each year reporting actual quantities and costs incurred for natural gas supplies and upstream
services for the 12-month period ending the previous June 30.
Natural Gas Supply and Costs
PSCo actively seeks natural gas supply, transportation and storage alternatives to yield a diversified portfolio that
provides increased flexibility, decreased interruption and financial risk, and economical rates. In addition, PSCo
conducts natural gas price hedging activities that have been approved by the CPUC. This diversification involves
numerous supply sources with varied contract lengths.
The following table summarizes the average delivered cost per MMBtu of natural gas purchased for resale by PSCo’s
regulated retail natural gas distribution business:
2007 .................................................................. $5.87
2006 .................................................................. 7.09
2005 .................................................................. 8.01
PSCo has certain natural gas supply, transportation and storage agreements that include obligations for the purchase
and/or delivery of specified volumes of natural gas or to make payments in lieu of delivery. At Dec. 31, 2007, PSCo
was committed to approximately $1.9 billion in such obligations under these contracts, which expire in various years
from 2008 through 2028.
PSCo purchases natural gas by optimizing a balance of long-term and short-term natural gas purchases, firm
transportation and natural gas storage contracts. During 2007, PSCo purchased natural gas from approximately 40
suppliers.
See additional discussion of natural gas costs under Factors Affecting Results of Continuing Operations in
Management’s Discussion and Analysis under Item 7.
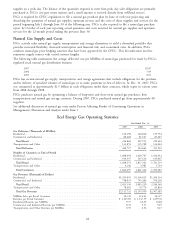
Xcel Energy Gas Operating Statistics
Year Ended Dec. 31,
2007 2006 2005
Gas Deliveries (Thousands of MMBtu)
Residential ..................................................... 138,198 126,846 135,794
Commercial and Industrial ........................................... 88,668 81,107 83,667
Total Retail ................................................... 226,866 207,953 219,461
Transportation and Other ............................................ 133,851 135,708 134,061
Total Deliveries ................................................. 360,717 343,661 353,522
Number of Customers at End of Period
Residential ..................................................... 1,688,994 1,669,747 1,636,652
Commercial and Industrial ........................................... 149,557 147,614 145,067
Total Retail ................................................... 1,838,551 1,817,361 1,781,719
Transportation and Other ............................................ 4,146 3,981 3,764
Total Customers ................................................ 1,842,697 1,821,342 1,785,483
Gas Revenues (Thousands of Dollars)
Residential ..................................................... $1,295,095 $1,330,025 $1,450,316
Commercial and Industrial ........................................... 738,035 755,204 794,230
Total Retail ................................................... 2,033,130 2,085,229 2,244,546
Transportation and Other ............................................ 78,602 70,770 62,839
Total Gas Revenues .............................................. $2,111,732 $2,155,999 $2,307,385
MMBtu Sales per Retail Customer ...................................... 123.39 114.43 123.17
Revenue per Retail Customer .......................................... $ 1,105.83 $ 1,147.39 $ 1,259.76
Residential Revenue per MMBtu ........................................ 9.37 10.49 10.68
Commercial and Industrial Revenue per MMBtu .............................. 8.32 9.31 9.49
Transportation and Other Revenue per MMBtu .............................. 0.59 0.52 0.47
28