Xcel Energy 2007 Annual Report Download - page 105
Download and view the complete annual report
Please find page 105 of the 2007 Xcel Energy annual report below. You can navigate through the pages in the report by either clicking on the pages listed below, or by using the keyword search tool below to find specific information within the annual report.-
 1
1 -
2
-
3
-
4
-
5
-
6
-
7
-
8
-
9
-
10
-
11
-
12
-
13
-
14
-
15
-
16
-
17
-
18
-
19
-
20
-
21
-
22
-
23
-
24
-
25
-
26
-
27
-
28
-
29
-
30
-
31
-
32
-
33
-
34
-
35
-
36
-
37
-
38
-
39
-
40
-
41
-
42
-
43
-
44
-
45
-
46
-
47
-
48
-
49
-
50
-
51
-
52
-
53
-
54
-
55
-
56
-
57
-
58
-
59
-
60
-
61
-
62
-
63
-
64
-
65
-
66
-
67
-
68
-
69
-
70
-
71
-
72
-
73
-
74
-
75
-
76
-
77
-
78
-
79
-
80
-
81
-
82
-
83
-
84
-
85
-
86
-
87
-
88
-
89
-
90
-
91
-
92
-
93
-
94
-
 95
95 -
 96
96 -
 97
97 -
 98
98 -
 99
99 -
 100
100 -
 101
101 -
 102
102 -
 103
103 -
 104
104 -
 105
105 -
 106
106 -
 107
107 -
 108
108 -
 109
109 -
 110
110 -
 111
111 -
 112
112 -
 113
113 -
 114
114 -
 115
115 -
116
-
117
-
118
-
119
-
120
-
121
-
122
-
123
-
124
-
125
-
126
-
127
-
128
-
129
-
130
-
131
-
132
-
133
-
134
-
135
-
136
-
137
-
138
-
139
-
140
-
141
-
142
-
143
-
144
-
145
-
146
-
147
-
148
-
149
-
150
-
151
-
152
-
153
-
154
-
155
-
156
 |
 |

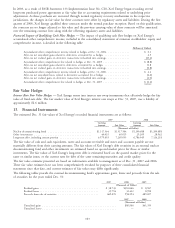
growth will be measured annually at the end of each fiscal year. The remaining awarded units plus associated earned
dividend equivalents will be settled, and the restricted period will lapse after the average of actual performance results
for the three components of an environmental index measured as a percentage of target performance meets or exceeds
100 percent. The environmental index will be measured annually at the end of each fiscal year. If the performance
criteria have not been met within four years of the date of grant, all associated units shall be forfeited. The 2005
environmental restricted stock units met their target as of Dec. 31, 2006 and were settled in shares in February 2007.
The 2005 restricted stock units measured on EPS growth and all 2006 restricted stock units met their targets and will
be settled in shares in the first quarter of 2008.
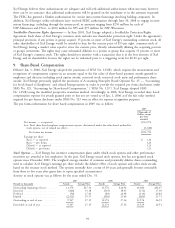
A summary of the status of our nonvested restricted stock units as of Dec. 31, 2007, and changes during the year
ended Dec. 31, 2007 are as follows:
Weighted
Average Grant
Date Fair Value
Share/Units Price
(Share/Units in
thousands)
Nonvested restricted stock units at Jan. 1, 2007 ........................ 861 $16.76
Granted ................................................. 313 19.08
Vested .................................................. (845) 16.80
Forfeited ................................................. (73) 17.06
Earned dividend equivalents ..................................... 43 17.26
Nonvested restricted stock units at Dec. 31, 2007 ....................... 299 19.08
The total aggregate intrinsic value of nonvested restricted stock units as of Dec. 31, 2007 was $1.0 million and the
weighted average remaining contractual life was 2.2 years.
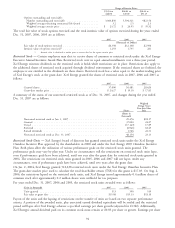
The total fair value and total intrinsic value of restricted stock units vested during the years ended Dec. 31, 2007, 2006
and 2005 were as follows:
2007 2006 2005
(Thousands of Dollars)
Fair value of restricted stock units vested .................. $14,192 $10,561 $—
Intrinsic value of restricted stock units vested(a) ............... 4,876 3,844 —
(a) Intrinsic value is calculated as the market price at vesting date less the fair value at grant date
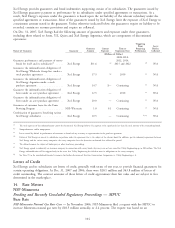
Performance Share Plan Awards (PSP) — Xcel Energy’s board of directors has granted performance share awards under
the Xcel Energy Omnibus Incentive Plan approved by the shareholders in 2000 and under the Xcel Energy 2005
Omnibus Incentive Plan. Both plans allow Xcel Energy to utilize various performance goals on the performance share
awards granted. The PSP has been entirely dependent on a single measure, the TSR and it is measured over a
three-year period. Xcel Energy’s TSR is compared to the TSR of other companies in the Edison Electric Institute’s
Electrics Index. At the end of the three-year period, potential payouts of the performance share awards range from
0 percent to 200 percent, depending on the Xcel Energy’s TSR compared to the peer group.
On Jan. 2, 2004, Xcel Energy granted 323,548 performance share awards under the Xcel Energy Omnibus Incentive
Plan. The grant-date market price used to calculate the TSR for this grant was $17.03. The 2004 performance share
awards met the TSR requirements as of Dec. 31, 2006 and were settled in shares and cash in February 2007.
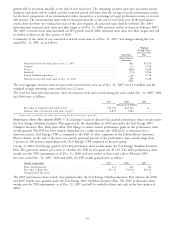
For years ended Dec. 31, 2007, 2006 and 2005, the PSP awards granted were as follows:
(Awards in thousands) 2007 2006 2005
Share awards granted ............................... 231 262 324
Fair value at grant date ............................. $17.33 $13.64 $18.10
Vesting period (in years) ............................333
The 2005 performance share awards were granted under the Xcel Energy Omnibus Incentive Plan whereas the 2006
and 2007 awards were granted under the Xcel Energy 2005 Omnibus Incentive Plan. The 2005 performance share
awards met the TSR requirements as of Dec. 31, 2007 and will be settled in shares and cash in the first quarter of
2008.
95