Xcel Energy 2007 Annual Report Download - page 149
Download and view the complete annual report
Please find page 149 of the 2007 Xcel Energy annual report below. You can navigate through the pages in the report by either clicking on the pages listed below, or by using the keyword search tool below to find specific information within the annual report.-
 1
1 -
2
-
3
-
4
-
5
-
6
-
7
-
8
-
9
-
10
-
11
-
12
-
13
-
14
-
15
-
16
-
17
-
18
-
19
-
20
-
21
-
22
-
23
-
24
-
25
-
26
-
27
-
28
-
29
-
30
-
31
-
32
-
33
-
34
-
35
-
36
-
37
-
38
-
39
-
40
-
41
-
42
-
43
-
44
-
45
-
46
-
47
-
48
-
49
-
50
-
51
-
52
-
53
-
54
-
55
-
56
-
57
-
58
-
59
-
60
-
61
-
62
-
63
-
64
-
65
-
66
-
67
-
68
-
69
-
70
-
71
-
72
-
73
-
74
-
75
-
76
-
77
-
78
-
79
-
80
-
81
-
82
-
83
-
84
-
85
-
86
-
87
-
88
-
89
-
90
-
91
-
92
-
93
-
94
-
95
-
96
-
97
-
98
-
99
-
100
-
101
-
102
-
103
-
104
-
105
-
106
-
107
-
108
-
109
-
110
-
111
-
112
-
113
-
114
-
115
-
116
-
117
-
118
-
119
-
120
-
121
-
122
-
123
-
124
-
125
-
126
-
127
-
128
-
129
-
130
-
131
-
132
-
133
-
134
-
135
-
136
-
137
-
138
-
 139
139 -
 140
140 -
 141
141 -
 142
142 -
 143
143 -
 144
144 -
 145
145 -
 146
146 -
 147
147 -
 148
148 -
 149
149 -
 150
150 -
 151
151 -
 152
152 -
 153
153 -
 154
154 -
 155
155 -
 156
156
 |
 |

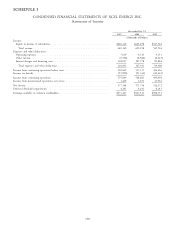
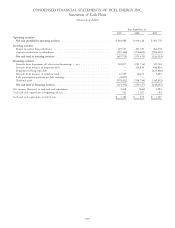
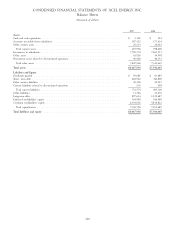
CONDENSED FINANCIAL STATEMENTS OF XCEL ENERGY INC.
Statements of Cash Flows
(thousands of dollars)
Years Ended Dec. 31
2007 2006 2005
Operating activities:
Net cash provided by operating activities ............................. $566,688 $ 634,128 $ 391,776
Investing activities:
Return of capital from subsidiaries ................................. 129,551 201,185 262,378
Capital contributions to subsidiaries ................................ (559,266) (576,600) (504,402)
Net cash used in investing activities ................................ (429,715) (375,415) (242,024)
Financing activities:
Proceeds from (repayment of) short-term borrowings — net ................. 238,877 (211,716) 325,516
Proceeds from issuance of long-term debt ............................. — 294,830 484,824
Repayment of long-term debt .................................... — — (625,000)
Proceeds from issuance of common stock ............................. 10,539 16,275 9,085
Early participation payment on debt exchange .......................... (4,859) — —
Dividends paid ............................................. (378,892) (358,746) (343,092)
Net cash used in financing activities ................................ (134,335) (259,357) (148,667)
Net increase (decrease) in cash and cash equivalents ........................ 2,638 (644) 1,085
Cash and cash equivalents at beginning of year ........................... 523 1,167 82
Cash and cash equivalents at end of year ............................... $ 3,161 $ 523 $ 1,167
139