Xcel Energy 2007 Annual Report Download - page 34
Download and view the complete annual report
Please find page 34 of the 2007 Xcel Energy annual report below. You can navigate through the pages in the report by either clicking on the pages listed below, or by using the keyword search tool below to find specific information within the annual report.-
 1
1 -
2
-
3
-
4
-
5
-
6
-
7
-
8
-
9
-
10
-
11
-
12
-
13
-
14
-
15
-
16
-
17
-
18
-
19
-
20
-
21
-
22
-
23
-
 24
24 -
 25
25 -
 26
26 -
 27
27 -
 28
28 -
 29
29 -
 30
30 -
 31
31 -
 32
32 -
 33
33 -
 34
34 -
 35
35 -
 36
36 -
 37
37 -
 38
38 -
 39
39 -
 40
40 -
 41
41 -
 42
42 -
 43
43 -
 44
44 -
45
-
46
-
47
-
48
-
49
-
50
-
51
-
52
-
53
-
54
-
55
-
56
-
57
-
58
-
59
-
60
-
61
-
62
-
63
-
64
-
65
-
66
-
67
-
68
-
69
-
70
-
71
-
72
-
73
-
74
-
75
-
76
-
77
-
78
-
79
-
80
-
81
-
82
-
83
-
84
-
85
-
86
-
87
-
88
-
89
-
90
-
91
-
92
-
93
-
94
-
95
-
96
-
97
-
98
-
99
-
100
-
101
-
102
-
103
-
104
-
105
-
106
-
107
-
108
-
109
-
110
-
111
-
112
-
113
-
114
-
115
-
116
-
117
-
118
-
119
-
120
-
121
-
122
-
123
-
124
-
125
-
126
-
127
-
128
-
129
-
130
-
131
-
132
-
133
-
134
-
135
-
136
-
137
-
138
-
139
-
140
-
141
-
142
-
143
-
144
-
145
-
146
-
147
-
148
-
149
-
150
-
151
-
152
-
153
-
154
-
155
-
156
 |
 |

• For the Harrington station, the coal supply contract with TUCO expires in 2016.
• For the Tolk station, the coal supply contract with TUCO expires in 2017.
• As of Dec. 31, 2007, coal supplies at the Harrington and Tolk sites were approximately 34 and 31 days supply,
respectively.
• TUCO has coal agreements to supply 100 percent of SPS’ coal requirements in 2008 and 2009, and 82 percent
of the 2010 coal requirements, which are sufficient quantities to meet the primary needs of the Harrington and
Tolk stations.
SPS uses both firm and interruptible natural gas and standby oil in combustion turbines and certain boilers. Natural
gas supplies and associated transportation and storage services for SPS’ power plants are procured under contracts with
various terms to provide an adequate supply of fuel. The supply contracts expire in various years from 2008 through
2010. The transportation and storage contracts expire in various years from 2008 to 2033. Certain natural gas supply
and transportation agreements include obligations for the purchase and/or delivery of specified volumes of natural gas
or to make payments in lieu of delivery. At Dec. 31, 2007, SPS’ commitments related to supply contracts were
approximately $31 million and transportation and storage contracts were approximately $254 million.
Wholesale Commodity Marketing Operations
SPS conducts various wholesale marketing operations, including the purchase and sale of electric capacity, energy and
energy related products. SPS uses physical and financial instruments to minimize commodity price and credit risk and
hedge supplies and purchases. See additional discussion under Item 7A—Quantitative and Qualitative Disclosures About
Market Risk.
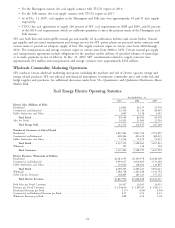
Xcel Energy Electric Operating Statistics
Year Ended Dec. 31,
2007 2006 2005
Electric Sales (Millions of Kwh)
Residential ................................................. 24,866 24,153 23,930
Commercial and Industrial ....................................... 62,396 61,314 60,049
Public Authorities and Other ...................................... 1,087 1,118 1,091
Total Retail .............................................. 88,349 86,585 85,070
Sales for Resale ............................................... 24,202 23,960 22,194
Total Energy Sold .......................................... 112,551 110,545 107,264
Number of Customers at End of Period
Residential ................................................. 2,859,262 2,831,704 2,791,859
Commercial and Industrial ....................................... 408,366 403,678 400,035
Public Authorities and Other ...................................... 71,726 73,279 75,937
Total Retail .............................................. 3,339,354 3,308,661 3,267,831
Wholesale .................................................. 129 138 128
Total Customers ........................................... 3,339,483 3,308,799 3,267,959
Electric Revenues (Thousands of Dollars)
Residential ................................................. $2,281,354 $2,149,978 $2,048,100
Commercial and Industrial ....................................... 4,099,017 4,014,809 3,733,648
Public Authorities and Other ...................................... 118,024 118,660 110,895
Total Retail .............................................. 6,498,395 6,283,447 5,892,643
Wholesale .................................................. 1,180,728 1,141,248 1,193,762
Other Electric Revenues ......................................... 168,869 183,323 157,232
Total Electric Revenues ...................................... $7,847,992 $7,608,018 $7,243,637
Kwh Sales per Retail Customer ..................................... 26,457 26,169 26,033
Revenue per Retail Customer ...................................... $1,946.00 $ 1,899.09 $ 1,803.23
Residential Revenue per Kwh ...................................... 9.17¢ 8.90¢ 8.56¢
Commercial and Industrial Revenue per Kwh ............................ 6.57 6.55 6.22
Wholesale Revenue per Kwh ...................................... 4.88 4.76 5.38
24