Whole Foods 2015 Annual Report Download - page 7
Download and view the complete annual report
Please find page 7 of the 2015 Whole Foods annual report below. You can navigate through the pages in the report by either clicking on the pages listed below, or by using the keyword search tool below to find specific information within the annual report.-
 1
1 -
 2
2 -
 3
3 -
 4
4 -
 5
5 -
 6
6 -
 7
7 -
 8
8 -
 9
9 -
 10
10 -
 11
11 -
 12
12 -
 13
13 -
 14
14 -
 15
15 -
 16
16 -
 17
17 -
 18
18 -
19
-
20
-
21
-
22
-
23
-
24
-
25
-
26
-
27
-
28
-
29
-
30
-
31
-
32
-
33
-
34
-
35
-
36
-
37
-
38
 |
 |

1
Disclaimer on Forward-looking Statements
Certain statements in this Report on Form 10-K and from time to time in other filings with the Securities and Exchange
Commission, news releases, reports, and other written and oral communications made by us and our representatives, constitute
forward-looking statements within the meaning of the U.S. Private Securities Litigation Reform Act of 1995. These forward-
looking statements are often identified by words such as “anticipate,” “believe,” “intend,” “estimate,” “expect,” “continue,”
“could,” “can,” “may,” “will,” “likely,” “depend,” “would,” “plan,” “project,” “predict,” “goal,” “target,” “sustain,” “seek” and
similar expressions, and include references to assumptions and relate to our future prospects, developments and business
strategies. Except for the historical information contained herein, the matters discussed in this report are forward-looking
statements that involve risks and uncertainties that may cause our actual results to be materially different from such forward-
looking statements and could materially adversely affect our business, financial condition, operating results and cash flows.
These risks and uncertainties include general business conditions, changes in overall economic conditions that impact consumer
spending, the impact of competition and other factors which are often beyond the control of the Company, as well other risks
listed in Part I, “Item 1A. Risk Factors,” of this report and risks and uncertainties not presently known to us or that we currently
deem immaterial. We wish to caution you that you should not place undue reliance on such forward-looking statements, which
speak only as of the date on which they were made. We do not undertake any obligation to update forward-looking statements.
This information should be read in conjunction with the consolidated financial statements and the accompanying notes included
in this report.
Unless otherwise specified, references to “Whole Foods Market,” “Company,” or “we” in this report include Whole Foods
Market, Inc. and its consolidated subsidiaries.
PART I
Item 1. Business.
General
Whole Foods Market is the leading natural and organic foods supermarket, the first national “Certified Organic” grocer, and
uniquely positioned as America’s Healthiest Grocery Store™. The Company incorporated in 1978, opened the first Whole Foods
Market store in 1980, and is based in Austin, Texas. We completed our initial public offering in January 1992, and our common
stock trades on the NASDAQ Global Select Market under the symbol “WFM.”
Whole Foods Market is a mission-driven company that aims to set the standards of excellence in food retailing. Our motto –
Whole Foods, Whole People, Whole Planet – emphasizes that our vision reaches far beyond food retailing. Our success is
measured by customer satisfaction, team member happiness and excellence, return on invested capital, active environmental
stewardship, service in our local and global communities, and win-win supplier partnerships, among other things. Through our
growth, we have had a significant and positive impact on the natural and organic foods movement throughout the United States,
helping lead the industry to nationwide acceptance over the last 37 years.
We have one operating segment, natural and organic foods supermarkets. We are the largest natural and organic foods supermarket
in the U.S., the 5th largest public food retailer, and the 10th largest food retailer overall based on 2014 sales rankings from
Progressive Grocer. As of September 27, 2015, we operated 431 stores in the United States (“U.S.”), Canada, and the United
Kingdom (“U.K.”), averaging over eight million customer visits each week. Our stores average 39,000 square feet in size and
are supported by our Austin headquarters, regional offices, distribution centers, bakehouse facilities, commissary kitchens,
seafood-processing facilities, a produce procurement center, and a specialty coffee and tea procurement and roasting operation.
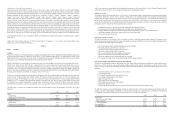
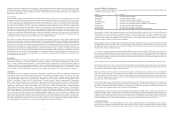
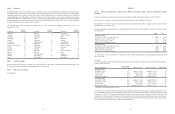
The following is a summary of our annual percentage sales and net long-lived assets by geographic area for the fiscal years
indicated:
2015 2014 2013
Sales:
United States 96.9% 96.7% 96.7%
Canada and United Kingdom 3.1 3.3 3.3
Total sales 100.0% 100.0% 100.0%
Long-lived assets, net:
United States 97.4% 96.0% 95.7%
Canada and United Kingdom 2.6 4.0 4.3
Total long-lived assets, net 100.0% 100.0% 100.0%
2
A five-year summary of certain financial and operating information can be found in Part II, “Item 6. Selected Financial Data,”
of this report. See also Part II, “Item 8. Financial Statements and Supplementary Data.”
Industry Overview
According to Nielsen TDLinx and Progressive Grocer, the U.S. supermarket industry, which includes conventional supermarkets,
supercenters, warehouse grocery stores, military commissaries and limited-assortment and natural/gourmet-positioned
supermarkets, had approximately $638.3 billion in sales in 2014, a 3% increase over the prior year. Within this broader category,
natural product sales through retail channels were approximately $98.6 billion, a 9% increase over the prior year, according to
Natural Foods Merchandiser, a leading trade publication for the natural foods industry. We believe the growth in sales of natural
and organic foods is being driven by numerous factors, including:
• heightened awareness of the role that healthy eating plays in long-term wellness;
• a better-educated and wealthier populace whose median age is increasing each year;
• a highly influential younger generation that values health, sustainability, organic, local and ethical trade;
• increasing consumer concern over where and how food is produced; and
• various environmental concerns.
Our Purpose and Core Values
We believe that much of our success to date is because we remain a uniquely mission-driven company. The purpose of our
business is not only to generate profits but to create value for all of our major stakeholders, each of which is linked interdependently.
Our Core Values succinctly express this purpose:
• We sell the highest quality natural and organic products available.
• We satisfy, delight and nourish our customers.
• We support team member happiness and excellence.
• We create wealth through profits and growth.
• We serve and support our local and global communities.
• We practice and advance environmental stewardship.
• We create ongoing win-win partnerships with our suppliers.
• We promote the health of our stakeholders through healthy eating education.
Our Quality Standards and Differentiated Product Offering
We believe our high quality standards differentiate our stores from other supermarkets and enable us to attract and maintain a
broad base of loyal customers. Our groundbreaking quality standards ban hundreds of ingredients commonly found in other
stores as well as numerous manufacturing, farming, fishing and ranching practices that don’t measure up. Here are a few
highlights:
• No artificial flavors, colors, sweeteners or preservatives
• No hydrogenated fats
• No meat from animals raised with antibiotics, ever
• No synthetic nitrates added to cured meat
• Eggs from cage-free hens
• Fifty banned body care ingredients
• Wild-caught seafood rated for sustainability
• Responsibly farmed seafood
• Cleaning products with full disclosure of ingredients, rated for safety and environmental impact
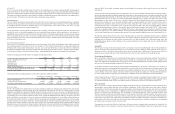
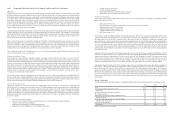
We offer the broadest selection of high-quality natural and organic products, with a strong emphasis on perishable foods. An
average store carries approximately 34,000 SKUs, with certain of our larger stores carrying up to 52,000 SKUs. The following
is a summary of annual percentage sales by product category for the fiscal years indicated:
2015 2014 2013
Perishables:
Prepared foods and bakery 19.0% 19.2% 19.0%
Other perishables 47.5 47.6 47.2
Total perishables 66.5 66.8 66.2
Non-perishables 33.5 33.2 33.8
Total sales 100.0% 100.0% 100.0%