Whole Foods 2015 Annual Report Download - page 16
Download and view the complete annual report
Please find page 16 of the 2015 Whole Foods annual report below. You can navigate through the pages in the report by either clicking on the pages listed below, or by using the keyword search tool below to find specific information within the annual report.-
 1
1 -
2
-
3
-
4
-
5
-
 6
6 -
 7
7 -
 8
8 -
 9
9 -
 10
10 -
 11
11 -
 12
12 -
 13
13 -
 14
14 -
 15
15 -
 16
16 -
 17
17 -
 18
18 -
 19
19 -
 20
20 -
 21
21 -
 22
22 -
 23
23 -
 24
24 -
 25
25 -
 26
26 -
27
-
28
-
29
-
30
-
31
-
32
-
33
-
34
-
35
-
36
-
37
-
38
 |
 |

19
Item 7. Management’s Discussion and Analysis of Financial Condition and Results of Operations.
Overview
Whole Foods Market is the leading natural and organic foods supermarket, the first national “Certified Organic” grocer, and
uniquely positioned as America’s Healthiest Grocery Store™. We are a mission-driven company that aims to set the standards
of excellence in food retailing. Our success is measured by customer satisfaction, team member happiness and excellence, return
on invested capital, active environmental stewardship, service in our local and global communities, and win-win supplier
partnerships, among other things. Through our growth, we have had a significant and positive impact on the natural and organic
foods movement throughout the United States, helping lead the industry to nationwide acceptance. The Company incorporated
in 1978, opened the first Whole Foods Market store in 1980, and as of September 27, 2015, operated 431 stores: 412 stores in
42 U.S. states and the District of Columbia; 10 stores in Canada; and 9 stores in the United Kingdom. We have one operating
segment, natural and organic foods supermarkets.
Our continued growth depends on our ability to increase sales in our comparable stores and open new stores. Our growth strategy
includes opening new stores in existing and new areas and operating those stores successfully. The Company’s average weekly
sales and gross profit as a percentage of sales are typically highest in the second and third fiscal quarters, and lowest in the fourth
fiscal quarter due to seasonally slower sales during the summer months. Gross profit as a percentage of sales is also lower in
the first fiscal quarter due to the product mix of holiday sales.
Sales of a store are deemed to be comparable commencing in the fifty-seventh full week after the store was opened or acquired.
Stores closed for eight or more days are excluded from the comparable store base from the first fiscal week of closure until re-
opened for a full fiscal week. Comparable store sales growth is calculated on a same-calendar-week to same-calendar-week
constant currency basis. All prior year calculations have been updated to reflect the current definition. Companies define
comparable store sales differently; thus growth rates across companies may not be comparable.
The Company reports its results of operations on a 52- or 53-week fiscal year ending on the last Sunday in September. Fiscal
years 2015, 2014 and 2013 were 52-week years.
Economic and Industry Factors
Food retailing is a large, intensely competitive industry. According to Nielsen TDLinx and Progressive Grocer, the U.S.
supermarket industry, which includes conventional supermarkets, supercenters, warehouse grocery stores, military commissaries
and limited-assortment and natural/gourmet-positioned supermarkets, had approximately $638.3 billion in sales in 2014, a 3%
increase over the prior year. Within this broader category, natural product sales through retail channels totaled approximately
$98.6 billion, increasing 9% over the prior year, according to Natural Foods Merchandiser. Our competition includes but is not
limited to local, regional, national and international conventional and specialty supermarkets, natural foods stores, warehouse
membership clubs, online retailers, smaller specialty stores, farmers’ markets, restaurants and home delivery, each of which
competes with us on the basis of store ambiance and experience, product selection and quality, customer service, price,
convenience or a combination of these factors.
We offer the broadest selection of high-quality natural and organic products, with a strong emphasis on perishable foods. We
believe our high quality standards differentiate our stores from other supermarkets and enable us to attract and maintain a broad
base of loyal customers. Our groundbreaking quality standards ban hundreds of ingredients commonly found in other stores as
well as numerous manufacturing, farming, fishing and ranching practices that don’t measure up.
Overview of Fiscal Year 2015
During fiscal year 2015, we achieved record total sales of $15.4 billion, an 8.4% increase over the prior year. Comparable store
sales increased 2.5%. Average weekly sales per store were $715,000, translating to sales per gross square foot of approximately
$970. EBITDA totaled $1.3 billion, or 8.4% of sales, and diluted earnings per share were $1.48. For the fiscal year, the Company
produced $1.1 billion in cash flow from operations and invested $851 million in capital expenditures, of which $516 million
related to new locations. This resulted in free cash flow of $278 million. In addition, the Company paid $184 million in quarterly
dividends to shareholders and repurchased $513 million of common stock. Our progress on strategic initiatives, during fiscal
year 2015, included:
• A record 38 new stores openings
• Sales of over $2.1 billion in Exclusive Brands and close to $3.0 billion in prepared foods and bakery
• Our first ever national brand campaign
• Implementation of Workday for online HR management
• Introduction of labor scheduling to one of our largest store teams
20
• Launch of our new mobile app
• Pilot of our affinity program
• Partnering with Instacart to offer fresh grocery delivery
• Initial rollout of a new, unified point-of-sale system
Fiscal Year 2016 Outlook
The Company remains focused on the metrics it believes are key to the long-term health of the Company. The Company’s annual
targets for fiscal year 2016 are:
• Sales growth of 3% to 5%;
• Approximately 30 new stores, including three 365 stores and two to three relocations;
• Square footage growth of 7% or greater;
• EBITDA margin of approximately 8.5%;
• Capital expenditures of 5% of sales; and
• ROIC greater than 13.5%.
The Company’s results are highly dependent on comparable store sales, which have been particularly difficult to predict in this
competitive landscape. While there has been some stabilization in the two-year comparable store sales trend since the end of
the fourth quarter of fiscal year 2015, it has been only a short period of time. The Company is hopeful that comparable store
sales will improve over the course of the fiscal year given its toughest comparison is in the first quarter, and many sales-building
initiatives are still gaining traction or are planned to roll out later in the year. The higher end of the sales outlook reflects 2.8%
two-year comparable store sales, in line with the current run rate, and flat comparable store sales for the year, improving from
-2% in the first quarter, to relatively flat in the second and third quarters, to 3% by the fourth quarter. The lower end of the sales
outlook reflects the possibility that comparable store sales could get marginally worse before they get better, with an inflection
point later in the year.
Primarily reflecting its value efforts, the Company expects the year-over-year decline in gross margin, excluding LIFO, in fiscal
year 2016 to be greater than last year’s 45 basis point decline. The Company has identified selling, general and administrative
expense improvements of approximately 60 basis points for the fiscal year, including the impact of the recent restructuring.
These savings are expected to be greater in the second half of the year than in the first and more than offset by the cost of
initiatives to drive traffic and sales, as well as higher occupancy, depreciation and other costs. Therefore, the Company expects
a decline in operating margin of up to 75 basis points, from the 6.1% reported for fiscal year 2015, excluding charges.
Subsequent to the end of fiscal year 2015, the Company announced a new capital allocation strategy that reflects confidence in
the Company’s future growth and cash flow generation, while expanding its commitment to return capital to shareholders. As
part of this strategy, the Company’s Board of Directors authorized a new $1.0 billion share repurchase program. The Company’s
intent is to spend the majority of the $1.0 billion buyback authorization in the first half of the fiscal year. Excluding an estimated
$0.05 to $0.07 per diluted share in net accretion related to these debt-financed buybacks, the Company expects diluted earnings
per share for the fiscal year of $1.50 or greater. The Company will be facing its toughest comparable store sales and earnings
comparisons in the first quarter, which will also include approximately $0.01 per diluted share in costs associated with the recent
restructuring.
Results of Operations
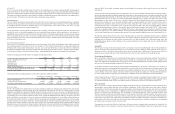
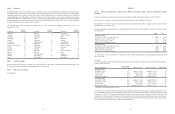
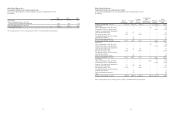
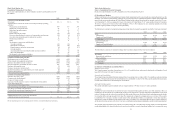
The following table sets forth the Company’s consolidated statements of operations data expressed as a percentage of sales:
2015 2014 2013
Sales 100.0% 100.0% 100.0%
Cost of goods sold and occupancy costs 64.8 64.5 64.2
Gross profit 35.2 35.5 35.8
Selling, general and administrative expenses 29.1 28.4 28.5
Pre-opening expenses 0.4 0.5 0.4
Relocation, store closure and lease termination costs 0.1 0.1 0.1
Operating income 5.6 6.6 6.8
Investment and other income, net of interest expense 0.1 0.1 0.1
Income before income taxes 5.7 6.7 6.9
Provision for income taxes 2.2 2.6 2.7
Net income 3.5% 4.1% 4.3%
Figures may not sum due to rounding.