Whole Foods 2015 Annual Report Download - page 17
Download and view the complete annual report
Please find page 17 of the 2015 Whole Foods annual report below. You can navigate through the pages in the report by either clicking on the pages listed below, or by using the keyword search tool below to find specific information within the annual report.-
 1
1 -
2
-
3
-
4
-
5
-
6
-
 7
7 -
 8
8 -
 9
9 -
 10
10 -
 11
11 -
 12
12 -
 13
13 -
 14
14 -
 15
15 -
 16
16 -
 17
17 -
 18
18 -
 19
19 -
 20
20 -
 21
21 -
 22
22 -
 23
23 -
 24
24 -
 25
25 -
 26
26 -
 27
27 -
28
-
29
-
30
-
31
-
32
-
33
-
34
-
35
-
36
-
37
-
38
 |
 |

21
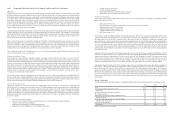
Sales
Sales totaled approximately $15.4 billion, $14.2 billion and $12.9 billion in fiscal years 2015, 2014 and 2013, respectively,
representing increases of 8.4%, 9.9% and 10.4% over the previous fiscal years, respectively. Sales increases for all years are
due to comparable store sales increases and stores opened or acquired less than one fiscal year. Total sales increased 12.6% in
fiscal year 2013 over the previous fiscal year on a comparative 52-week basis. Comparable store sales increased 2.5%, 4.4%
and 7.0% during fiscal years 2015, 2014 and 2013, respectively, and contributed approximately 93.3%, 94.0% and 94.1% to
total sales in fiscal years 2015, 2014 and 2013, respectively. As of September 27, 2015, there were 390 locations in the comparable
store base as compared to 358 locations and 331 locations as of September 28, 2014 and September 29, 2013, respectively.
Gross Profit
Gross profit totaled approximately $5.4 billion, $5.0 billion and $4.6 billion in fiscal years 2015, 2014 and 2013, respectively.
Gross profit as a percentage of sales decreased 34 basis points in fiscal year 2015 compared to the prior fiscal year. Net LIFO
inventory reserves increased approximately $1 million during fiscal year 2015 compared to an increase of approximately $16
million in fiscal year 2014, resulting in a positive impact of 11 basis points year over year. In fiscal year 2013, the net LIFO
inventory reserve increase totaled approximately $2 million. Results also include a supplier credit of approximately $9 million,
or six basis points, during fiscal year 2015. Excluding these charges, gross profit as a percentage of sales decreased 51 basis
points in fiscal year 2015 compared to the prior fiscal year, reflecting our ongoing value strategy and increased spoilage in an
environment of weaker-than-anticipated sales. Gross profit as a percentage of sales decreased 30 basis points and increased 31
basis points in fiscal years 2014 and 2013, respectively, compared to the prior fiscal year. The decrease in fiscal year 2014 was
the result of the decision not to pass through all product cost increases to customers, while the increase in fiscal year 2013 was
driven primarily by an improvement in occupancy costs.
Our gross profit may increase or decrease slightly depending on the mix of sales from new stores, our value strategy, or the
impact of commodity costs or a host of other factors, including possible supply shortages and extreme weather-related disruptions.
Relative to existing stores, gross profit margins tend to be lower for new stores and increase as stores mature, reflecting lower
shrink as volumes increase, as well as increasing experience levels and operational efficiencies of the store teams.
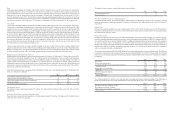
Selling, General and Administrative Expenses
Selling, general and administrative expenses totaled approximately $4.5 billion, $4.0 billion and $3.7 billion in fiscal years 2015,
2014 and 2013, respectively. During fiscal year 2015, selling, general, and administrative expenses included asset impairment
charges totaling approximately $47 million, one-time termination charges of $34 million, and approximately $8 million of
expense related to the implementation of California’s new paid sick leave law. Excluding these charges, selling, general and
administrative expenses increased eight basis points as a percentage of sales compared to the prior year. Selling, general, and
administrative expenses decreased nine basis points and 18 basis points as a percentage of sales in fiscal years 2014 and 2013,
respectively, compared to the prior year.
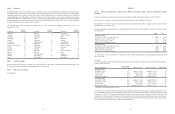
Share-based payment expense was included in the following line items on the Consolidated Statements of Operations for the
fiscal years indicated (in millions):
2015 2014 2013
Cost of goods sold and occupancy costs $ 2 $ 2 $ 2
Selling, general and administrative expenses 62 66 55
Share-based payment expense before income taxes 64 68 57
Income tax benefit (25) (26) (22)
Net share-based payment expense $ 39 $ 42 $ 35
Pre-opening Expenses
Pre-opening expenses totaled approximately $67 million, $67 million and $52 million in fiscal years 2015, 2014 and 2013,
respectively.
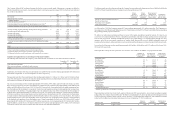
Relocation, Store Closure and Lease Termination Costs
Relocation, store closure and lease termination costs totaled approximately $16 million, $11 million and $12 million in fiscal
years 2015, 2014 and 2013, respectively.
22
The numbers of stores opened, acquired and relocated were as follows:
2015 2014 2013
New and acquired stores 32 37 27
Relocated stores 6 1 5
Investment and Other Income, net of Interest Expense
Investment and other income, net of interest expense, which includes gift card breakage, interest income, investment gains and
losses and other income, totaled approximately $17 million, $12 million and $11 million in fiscal years 2015, 2014 and 2013,
respectively.
Income Taxes
Income taxes resulted in an effective tax rate of approximately 39.0%, 38.8% and 38.4% in fiscal years 2015, 2014 and 2013,
respectively. The higher effective tax rate in fiscal year 2015 primarily reflects a shift in the mix and level of earnings throughout
the jurisdictions in which we operate.
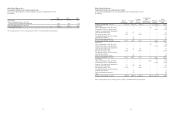
Non-GAAP measures
In addition to reporting financial results in accordance with generally accepted accounting principles, or GAAP, the Company
provides information regarding Earnings Before Interest, Taxes, Depreciation and Amortization (“EBITDA”), adjusted EBITDA,
free cash flow and Return on Invested Capital (“ROIC”) as additional information about its operating results. These measures
are not in accordance with, or an alternative to, GAAP. We believe that these presentations provide useful information to
management, analysts and investors regarding certain additional financial and business trends relating to our results of operations
and financial condition. In addition, management uses these measures for reviewing the financial results of the Company as
well as a component of incentive compensation.
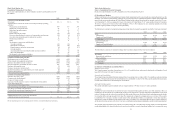
The Company defines adjusted EBITDA as EBITDA plus non-cash share-based payment expense and deferred rent. The following
is a tabular reconciliation of the non-GAAP financial measure adjusted EBITDA to GAAP net income, which the Company
believes is the most directly comparable GAAP financial measure. Adjusted EBITDA for the fiscal years indicated was as follows
(in millions):
2015 2014 2013
Net income $ 536 $ 579 $ 551
Provision for income taxes 342 367 343
Investment and other income, net of interest expense (17) (12) (11)
Operating income 861 934 883
Depreciation and amortization 439 377 339
EBITDA 1,300 1,311 1,222
Share-based payment expense 64 68 57
Deferred rent 34 40 37
Adjusted EBITDA $ 1,398 $ 1,419 $ 1,316
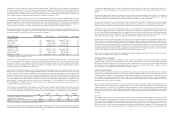
The Company defines free cash flow as net cash provided by operating activities less capital expenditures. The following is a
tabular reconciliation of the non-GAAP financial measure free cash flow for the fiscal years indicated (in millions):
2015 2014 2013
Net cash provided by operating activities $ 1,129 $ 1,088 $ 1,009
Development cost of new locations (516) (447) (339)
Other property and equipment expenditures (335) (263) (198)
Free cash flow $ 278 $ 378 $ 472