Whole Foods 2015 Annual Report Download - page 32
Download and view the complete annual report
Please find page 32 of the 2015 Whole Foods annual report below. You can navigate through the pages in the report by either clicking on the pages listed below, or by using the keyword search tool below to find specific information within the annual report.-
 1
1 -
2
-
3
-
4
-
5
-
6
-
7
-
8
-
9
-
10
-
11
-
12
-
13
-
14
-
15
-
16
-
17
-
18
-
19
-
20
-
21
-
 22
22 -
 23
23 -
 24
24 -
 25
25 -
 26
26 -
 27
27 -
 28
28 -
 29
29 -
 30
30 -
 31
31 -
 32
32 -
 33
33 -
 34
34 -
 35
35 -
 36
36 -
 37
37 -
 38
38
 |
 |

51
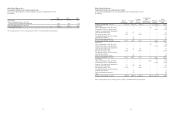
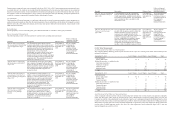
Stock Options
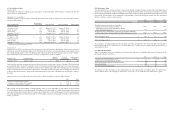
The following table summarizes stock option activity (in millions, except per share amounts and contractual lives in years):
Number
of options
outstanding
Weighted
average
exercise price
Weighted
average
remaining
contractual life
Aggregate
intrinsic
value
Outstanding options at September 30, 2012 20.0 $ 30.17
Options granted 4.3 51.33
Options exercised (4.1) 20.52
Options expired (0.1) 18.86
Options forfeited (0.9) 37.20
Outstanding options at September 29, 2013 19.2 $ 36.90
Options granted 5.3 40.25
Options exercised (1.5) 24.13
Options expired (0.1) 36.10
Options forfeited (0.6) 42.32
Outstanding options at September 28, 2014 22.3 $ 38.37
Options granted 5.3 44.30
Options exercised (2.2) 27.81
Options expired (0.3) 42.88
Options forfeited (0.8) 42.66
Outstanding options at September 27, 2015 24.3 $ 40.45 4.51 $ 32
Vested/expected to vest at September 27, 2015 23.3 $ 40.35 4.45 $ 32
Exercisable options at September 27, 2015 11.9 $ 36.96 3.35 $ 30
The weighted average grant date fair value of options granted during fiscal years 2015, 2014 and 2013 was $10.19, $9.67 and
$12.36, respectively. The aggregate intrinsic value of stock options at exercise, represented in the table above, was approximately
$46 million, $36 million and $125 million during fiscal years 2015, 2014 and 2013, respectively. The Company realized a tax
benefit from stock options exercised during fiscal years 2015, 2014 and 2013 totaling approximately $46 million, $36 million
and $123 million, respectively. The total fair value of shares vested during fiscal years 2015, 2014 and 2013 was approximately
$209 million, $192 million and $246 million, respectively, including the value of vested options exercised during those same
periods. As of the end of fiscal years 2015 and 2014, there was approximately $95 million and $108 million of unrecognized
share-based payment expense, respectively, related to unvested stock options, net of estimated forfeitures, related to
approximately 11.5 million shares and 11.9 million shares, respectively. The Company anticipates this expense to be recognized
over a weighted average period of 2.9 years.
Share-based payment expense related to vesting stock options recognized during fiscal years 2015, 2014 and 2013 totaled
approximately $60 million, $63 million and $56 million, respectively.
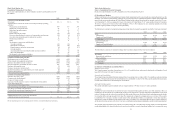
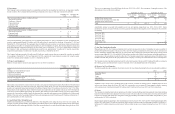
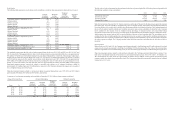
A summary of stock options outstanding and exercisable at September 27, 2015 follows (share amounts in millions):
Range of Exercise Prices Options Outstanding Options Exercisable
From To
Number
of options
outstanding
Weighted
average
exercise price
Weighted
average
remaining
life (in years)
Number
of options
exercisable
Weighted
average
exercise price
$ 9.45 $ 18.49 0.6 $ 9.53 0.65 0.6 $ 9.53
20.42 28.50 1.8 20.43 2.47 1.5 20.43
31.25 38.50 6.8 35.12 4.35 3.9 32.97
40.81 46.28 10.2 43.73 5.01 3.9 44.28
51.25 59.15 4.9 52.37 4.95 2.0 51.90
24.3 $ 40.45 4.51 11.9 $ 36.96
52
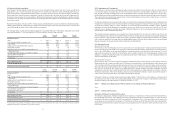
The fair value of stock option grants has been estimated at the date of grant using the Black-Scholes option pricing model with
the following weighted average assumptions:
2015 2014 2013
Expected dividend yield 1.000% 0.950% 0.880%
Risk-free interest rate 1.20% 1.18% 0.77%
Expected volatility 29.73% 30.96% 31.25%
Expected life, in years 4.04 4.04 3.96
Risk-free interest rate is based on the U.S. Treasury yield curve on the date of the grant for the time period equal to the expected
term of the grant. Expected volatility is calculated using a ratio of implied volatility based on the Newton-Raphson method of
bisection, and four or six year historical volatilities based on the expected life of each tranche of options. The Company determined
the use of both implied volatility and historical volatility represents a more accurate calculation of option fair value. Expected
life is calculated in two tranches based on weighted average percentage of unexpired options and exercise-after-vesting
information over the last five or seven years. Unvested options are included in the term calculation using the “mid-point scenario”
which assumes that unvested options will be exercised halfway between vest and expiration date. The assumptions used to
calculate the fair value of options granted are evaluated and revised, as necessary, to reflect market conditions and experience.
In addition to the above valuation assumptions, the Company estimates an annual forfeiture rate for unvested options and adjusts
fair value expense accordingly. The Company monitors actual forfeiture experience and adjusts the rate from time to time as
necessary.
Restricted Stock
During fiscal years 2015 and 2014, the Company awarded approximately 0.1 million shares and 0.2 million shares of restricted
common stock, respectively, pursuant to the Whole Foods Market 2009 Stock Incentive Plan. Fair value of the restricted share
issuances on grant date was not material during fiscal year 2015 and totaled approximately $11 million during fiscal year 2014.
Share-based payment expense related to restricted shares included in the “Selling, general and administrative expenses” line
item on the Consolidated Statements of Operations was not material during fiscal year 2015, 2014 or 2013. At September 27,
2015 and September 28, 2014, there was approximately $9 million and $10 million of unrecognized share-based payment
expense, respectively, related to unvested restricted stock. The Company anticipates this expense to be recognized over a weighted
average period of 3.1 years.