Whole Foods 2015 Annual Report Download - page 23
Download and view the complete annual report
Please find page 23 of the 2015 Whole Foods annual report below. You can navigate through the pages in the report by either clicking on the pages listed below, or by using the keyword search tool below to find specific information within the annual report.-
 1
1 -
2
-
3
-
4
-
5
-
6
-
7
-
8
-
9
-
10
-
11
-
12
-
 13
13 -
 14
14 -
 15
15 -
 16
16 -
 17
17 -
 18
18 -
 19
19 -
 20
20 -
 21
21 -
 22
22 -
 23
23 -
 24
24 -
 25
25 -
 26
26 -
 27
27 -
 28
28 -
 29
29 -
 30
30 -
 31
31 -
 32
32 -
 33
33 -
34
-
35
-
36
-
37
-
38
 |
 |
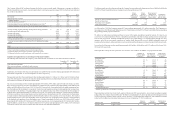
33
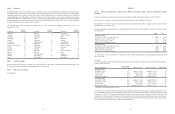
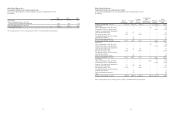
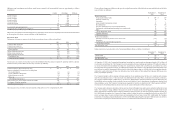
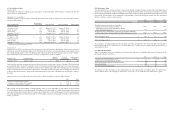
Whole Foods Market, Inc.
Consolidated Balance Sheets
(In millions)
Assets
September 27,
2015
September 28,
2014
Current assets:
Cash and cash equivalents $ 237 $ 190
Short-term investments - available-for-sale securities 155 553
Restricted cash 127 109
Accounts receivable 218 198
Merchandise inventories 500 441
Prepaid expenses and other current assets 108 97
Deferred income taxes 199 168
Total current assets 1,544 1,756
Property and equipment, net of accumulated depreciation and amortization 3,163 2,923
Long-term investments - available-for-sale securities 63 120
Goodwill 710 708
Intangible assets, net of accumulated amortization 79 81
Deferred income taxes 144 132
Other assets 38 24
Total assets $ 5,741 $ 5,744
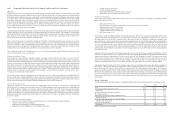
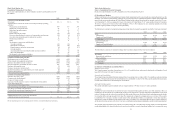
Liabilities and Shareholders’ Equity
Current liabilities:
Current installments of capital lease obligations $ 3 $ 2
Accounts payable 295 276
Accrued payroll, bonus and other benefits due team members 436 379
Dividends payable 45 43
Other current liabilities 473 557
Total current liabilities 1,252 1,257
Long-term capital lease obligations, less current installments 62 60
Deferred lease liabilities 587 548
Other long-term liabilities 71 66
Total liabilities 1,972 1,931
Commitments and contingencies
Shareholders’ equity:
Common stock, no par value, 1,200 and 600 shares authorized;
377.1 shares issued; 348.9 and 360.4 shares outstanding
at 2015 and 2014, respectively 2,904 2,863
Common stock in treasury, at cost, 28.2 and 16.7 shares at 2015 and 2014, respectively (1,124) (711)
Accumulated other comprehensive loss (28) (7)
Retained earnings 2,017 1,668
Total shareholders’ equity 3,769 3,813
Total liabilities and shareholders’ equity $ 5,741 $ 5,744
The accompanying notes are an integral part of these consolidated financial statements.
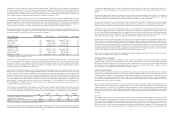
34
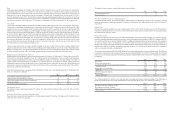
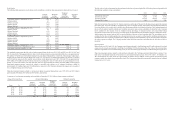
Whole Foods Market, Inc.
Consolidated Statements of Operations
Fiscal years ended September 27, 2015, September 28, 2014 and September 29, 2013
(In millions, except per share amounts)
2015 2014 2013
Sales $ 15,389 $ 14,194 $ 12,917
Cost of goods sold and occupancy costs 9,973 9,150 8,288
Gross profit 5,416 5,044 4,629
Selling, general and administrative expenses 4,472 4,032 3,682
Pre-opening expenses 67 67 52
Relocation, store closure and lease termination costs 16 11 12
Operating income 861 934 883
Investment and other income, net of interest expense 17 12 11
Income before income taxes 878 946 894
Provision for income taxes 342 367 343
Net income $ 536 $ 579 $ 551
Basic earnings per share $ 1.49 $ 1.57 $ 1.48
Weighted average shares outstanding 358.5 367.8 371.2
Diluted earnings per share $ 1.48 $ 1.56 $ 1.47
Weighted average shares outstanding, diluted basis 360.8 370.5 374.5
Dividends declared per common share $ 0.52 $ 0.48 $ 1.40
The accompanying notes are an integral part of these consolidated financial statements.