Westjet 2005 Annual Report Download - page 19
Download and view the complete annual report
Please find page 19 of the 2005 Westjet annual report below. You can navigate through the pages in the report by either clicking on the pages listed below, or by using the keyword search tool below to find specific information within the annual report.-
 1
1 -
2
-
3
-
4
-
5
-
6
-
7
-
8
-
 9
9 -
 10
10 -
 11
11 -
 12
12 -
 13
13 -
 14
14 -
 15
15 -
 16
16 -
 17
17 -
 18
18 -
 19
19 -
 20
20 -
 21
21 -
 22
22 -
 23
23 -
 24
24 -
 25
25 -
 26
26 -
 27
27 -
 28
28 -
 29
29 -
30
-
31
-
32
-
33
-
34
-
35
-
36
-
37
-
38
-
39
-
40
-
41
-
42
-
43
-
44
-
45
-
46
-
47
-
48
-
49
-
50
-
51
-
52
-
53
-
54
-
55
-
56
-
57
-
58
-
59
-
60
-
61
-
62
-
63
-
64
 |
 |

2005 WESTJET ANNUAL REPORT
17
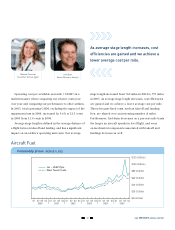
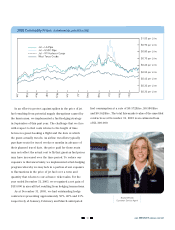
Commodity prices (PERIOD CLOSE)
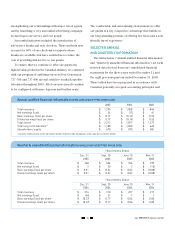
As average stage length increases, cost
efficiencies are gained and we achieve a
lower average cost per mile.
Q1 Q2 Q3 Q4 Q1 Q2 Q3 Q4 Q1 Q2 Q3 Q4 Q1 Q2 Q3 Q4 Q1 Q2 Q3 Q4 Q1 Q2 Q3 Q4
2000 2001 2002 2003 2004 2005
$0 USD/bbl
$20 USD/bbl
$40 USD/bbl
$60 USD/bbl
$80 USD/bbl
$100 USD/bbl
$120 USD/bbl
Jet – USGC Pipe
West Texas Crude
Marlene Fournier
Customer Service Agent
John Bart
Senior Business Analyst
Aircraft Fuel
stage length increased from 760 miles in 2004 to 797 miles
in 2005. As average stage length increases, cost efficiencies
are gained and we achieve a lower average cost per mile.
This is because fixed costs, such as takeoff and landing
fees, are shared over an increasing number of miles.
Furthermore, fuel-burn decreases on a per-seat-mile basis
the longer an aircraft spends in level flight, and wear
on mechanical components associated with takeoff and
landings decrease as well.
Operating cost per available seat mile (“CASM”) is a
useful measure when comparing our relative costs year
over year and comparing our performance to other airlines.
In 2005, total operating CASM, excluding the impact of the
impairment loss in 2004, increased by 9.6% to 12.5 cents
in 2005 from 11.4 cents in 2004.
Average stage length is defined as the average distance of
a flight between takeoff and landing, and has a significant
impact on an airline’s operating unit costs. Our average