Westjet 2005 Annual Report Download - page 17
Download and view the complete annual report
Please find page 17 of the 2005 Westjet annual report below. You can navigate through the pages in the report by either clicking on the pages listed below, or by using the keyword search tool below to find specific information within the annual report.-
 1
1 -
2
-
3
-
4
-
5
-
6
-
 7
7 -
 8
8 -
 9
9 -
 10
10 -
 11
11 -
 12
12 -
 13
13 -
 14
14 -
 15
15 -
 16
16 -
 17
17 -
 18
18 -
 19
19 -
 20
20 -
 21
21 -
 22
22 -
 23
23 -
 24
24 -
 25
25 -
 26
26 -
 27
27 -
28
-
29
-
30
-
31
-
32
-
33
-
34
-
35
-
36
-
37
-
38
-
39
-
40
-
41
-
42
-
43
-
44
-
45
-
46
-
47
-
48
-
49
-
50
-
51
-
52
-
53
-
54
-
55
-
56
-
57
-
58
-
59
-
60
-
61
-
62
-
63
-
64
 |
 |

2005 WESTJET ANNUAL REPORT
15
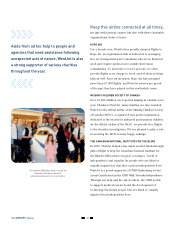
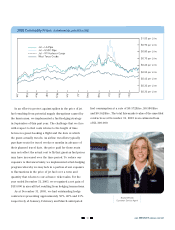
strengthening our relationships with major travel agents
and by launching a very successful advertising campaign
focused upon our service and our people.
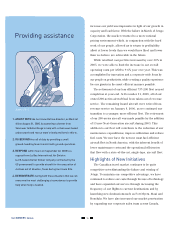
Successful initiatives included the introduction of
self-service kiosks and web check-in. These methods now
account for 40% of our check-ins at airports where
kiosks are available and have enabled us to reduce the
cost of providing this service to our guests.
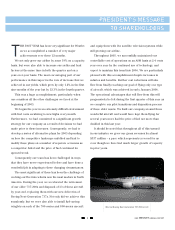
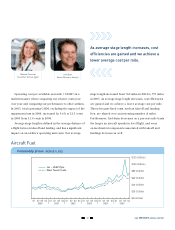
To ensure that we continue to offer our guests the
highest-value product in the Canadian industry, we continued
with our program of outfitting our new Next-Generation
737-700 and 737-800 aircraft with live seatback satellite
television throughout 2005. All of our new aircraft continue
to be configured with more legroom and leather seats.
The comfortable and entertaining environment we offer
our guests is a key competitive advantage that builds on
our long-standing promise of offering low fares and a safe,
friendly travel experience.
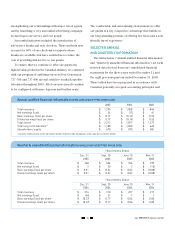
SELECTED ANNUAL
AND QUARTERLY INFORMATION
The tables below (“Annual audited financial information”
and “Quarterly unaudited financial information”) set forth
selected data derived from our consolidated financial
statements for the three years ended December 31 and
the eight previous quarters ended December 31, 2005.
These tables have been prepared in accordance with
Canadian generally accepted accounting principles and
Three Months Ended
Dec. 31 Sept. 30 June 30 Mar. 31
2005 2005 2005 2005
Total revenues $ 368 $ 406 $ 326 $ 295
Net earnings (loss) $ 2 $ 30 $ 2 $ (10)
Basic earnings (loss) per share
$ 0.01 $ 0.24 $ 0.02 $ (0.08)
Diluted earnings (loss) per share $ 0.01 $ 0.23 $ 0.02 $ (0.08)
Three Months Ended
Dec. 31 Sept. 30 June 30 Mar. 31
2004 2004 2004 2004
Total revenues $ 274 $ 310 $ 257 $ 217
Net earnings (loss) $ (46) $ 21 $ 7 $ 1
Basic earnings (loss) per share
$ (0.37) $ 0.17 $ 0.06 $ 0.00
Diluted earnings (loss) per share $ (0.37) $ 0.17 $ 0.06 $ 0.00
2005 2004 2003
Total revenues $ 1,395 $ 1,058 $ 864
Net earnings (loss) $ 24 $ (17) $ 61
Basic earnings (loss) per share
$ 0.19 $ (0.14) $ 0.52
Diluted earnings (loss) per share
$ 0.19 $ (0.14) $ 0.52
Total assets $ 2,213 $ 1,877 $ 1,477
Total long-term liabilities(1) $ 1,180 $ 1,020 $ 662
Shareholders’ equity $ 670 $ 590 $ 581
(1) Long-term liabilities include current and long-term portions of long-term debt and obligations under capital leases and other liabilities.
Annual audited financial information (IN MILLIONS EXCEPT PER SHARE DATA)
Quarterly unaudited financial information (IN MILLIONS EXCEPT PER SHARE DATA)