Westjet 2001 Annual Report Download - page 5
Download and view the complete annual report
Please find page 5 of the 2001 Westjet annual report below. You can navigate through the pages in the report by either clicking on the pages listed below, or by using the keyword search tool below to find specific information within the annual report.-
 1
1 -
 2
2 -
 3
3 -
 4
4 -
 5
5 -
 6
6 -
 7
7 -
 8
8 -
 9
9 -
 10
10 -
 11
11 -
 12
12 -
 13
13 -
 14
14 -
 15
15 -
 16
16 -
17
-
18
-
19
-
20
-
21
-
22
-
23
-
24
-
25
-
26
-
27
-
28
-
29
-
30
-
31
-
32
-
33
-
34
-
35
-
36
-
37
-
38
-
39
-
40
-
41
-
42
-
43
-
44
-
45
-
46
-
47
-
48
-
49
-
50
-
51
-
52
-
53
-
54
-
55
-
56
-
57
-
58
-
59
-
60
 |
 |
03
HIGHLIGHTS
Finance
Revenues
Earnings before income taxes
Net earnings
Net earnings per common share
Basic
Diluted
Operating Highlights
Revenue passenger miles
Available seat miles
Load factor
Yield per revenue passenger mile (cents)
Passenger revenue per available seat mile (cents)
Operating cost per available seat mile (cents)
Average stage length (miles)
2001
478.4
58.3
37.2
0.81
0.79
2001
2,236,270,397
2,995,516,958
74.7%
21.7
15.3
14.0
458.4
2000
332.5
52.7
30.3
0.72
0.69
2000
1,453,245,522
1,906,863,288
76.2%
22.9
17.4
14.6
419.2
1999
203.6
29.3
15.8
0.42
0.39
1999
902,945,131
1,249,316,243
72.3%
22.5
16.3
13.9
383.0
1998
125.4
12.4
6.5
0.19
0.19
1998
639,157,206
893,008,646
71.6%
19.6
14.1
12.6
378.0
(Dollars in millions except per share figures):
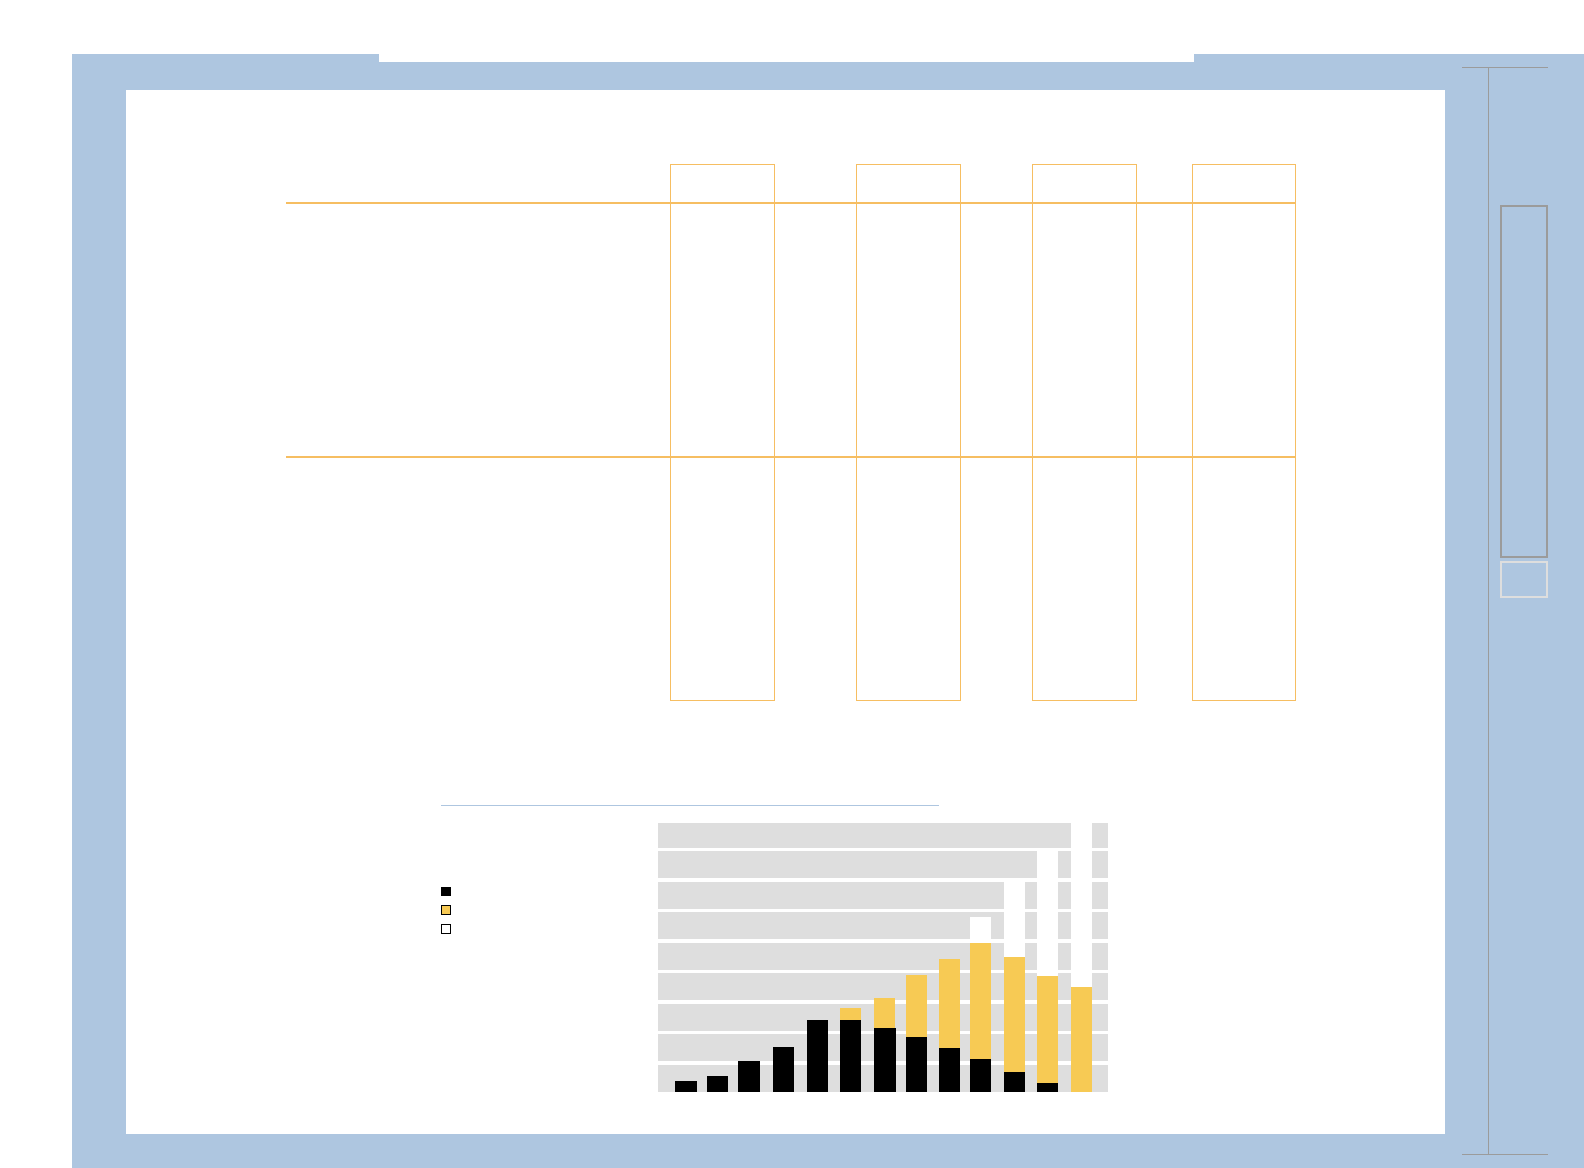
Fleet Plan
20
40
60
80
2006 200820042002200019981996
NUMBER OF AIRCRAFT
737-200 Series
New Generation 737-700 Series Firm
New Generation 737-700 Series Options