Wacom 2016 Annual Report Download - page 9
Download and view the complete annual report
Please find page 9 of the 2016 Wacom annual report below. You can navigate through the pages in the report by either clicking on the pages listed below, or by using the keyword search tool below to find specific information within the annual report.-
 1
1 -
 2
2 -
 3
3 -
 4
4 -
 5
5 -
 6
6 -
 7
7 -
 8
8 -
 9
9 -
 10
10 -
 11
11 -
 12
12 -
 13
13 -
 14
14 -
 15
15 -
 16
16
 |
 |

1615
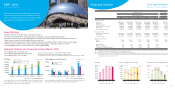
Financial Section Five-Year Summary
For the fiscal year:
Net sales
Gross profit
Operating income
Income before income taxes
Net income
Comprehensive income
At fiscal year-end:
Cash and cash equivalents
Total assets
Total net assets
Net income per share
Basic
Diluted
Equity ratio(%)
Return on equity (%)
The number of employee(person)
$688,392
272,772
32,520
31,927
20,496
12,758
$127,485
457,638
275,971
$0.12
0.12
Thousands of
U.S. dollars
Year ended
March 31
2016
¥40,705,578
18,040,993
4,067,475
3,504,537
2,181,341
2,007,351
¥11,969,873
34,129,398
18,917,895
¥13.66
13.65
55.2
11.7
785
¥61,068,078
24,235,314
7,915,051
7,545,8 05
4,770,485
5,870,100
¥21,596,429
50,124,193
29,211,533
¥29.81
29.69
58.1
19.9
930
¥74,557,460
30,050,300
6,142,669
5,106,695
3,473,144
3,821,345
¥16,686,619
51,456,857
33,858,970
¥20.86
20.82
65.4
10.5
1,072
¥77,568,014
30,735,985
3,664,362
3,597,489
2,309,514
1,437,540
¥14,365,031
51,566,632
31,096,396
¥14.00
13.99
60.0
7.1
1,055
Thousands of yen
Years ended March 31
2012 2014 2016
¥78,615,309
29,931,103
8,663,092
8,268,645
5,248,762
6,799,072
¥15,393,939
50,859,157
32,799,328
¥31.31
31.13
64.2
17.0
1,035
20152013
Note 1: The translation of Japanese yen amounts into U.S. dollar amounts is included solely for the convenience of the readers outside Japan and has been calculated at the rate
of JP¥112.68 = U.S.$1.00, the approximate rate of exchange on March 31, 2016.
Note 2: Net Income from 2016. 3 F. Y. is equivalent to Net Income Attributable to Owners of Parent.
Note 3: The Company conducted a 400-for-1 share split based on the resolution of the Board of Directors held on April 30, 2013, resolved to adopt the stock split and the unit
share system, effective as of June 1, 2013. Net income per share and diluted net income per share have been calculated assuming that the stock split was conducted at
the beginning of the year ended March 31, 2012.
18,041
24,235
(Millions of yen)
’12 ’13 ’12
(Millions of yen) (Millions of yen)
’13
(%) (%)
5
0
10
15
’12
(For the years ended March 31) (For the years ended March 31) (For the years ended March 31)
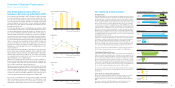
Net sales Operating income/Operating margin
Gross profit/Gross profit margin
40,706
’13 ’14
4,067
61,068
’14
78,615
’15
74,557
’16
77,568
44.0
39.7
29,931
’14
30,050
’15
40.3
30,736
’16
39.6
10.0
13.0
11.0
Wacom Co., Ltd. and its subsidiaries
0
10,000
20,000
30,000
40,000
50,000
60,000
70,000
80,000
0
2,000
4,000
6,000
8,000
10,000
8,663
’15
8.2
6,143
’16
4.7
3,664
7,915
0
10,000
20,000
30,000
5,000
15,000
25,000
35,000
30
40
50
35
45
38.1
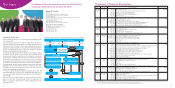
SBP - 2019
Wacom Strategic Business Plan
Evolve the business model toward mobile and cloud for
reaching new customers as well as expanding existing
business. In addition, improve the speed and profitability
by leveraging our global business infrastructure.
Basic Strategy
● Evolve the business toward mobile, cloud and ecosystems.
● Accelerate the growth with a new global business organization and enhanced global integration.
● Accelerate creative business with mobile product line expansion, 3D penetration and emerging market investment.
● Reach new consumer users with Digital Stationery and cloud.
● Expand the Technology Solution (former Component) Business with AES and WILLTM (Wacom Ink Layer Language).
● Enhance business workflow and security solutions by leveraging WILLTM and digital signature solutions.
● Leverage global business system for efficiency, speed and profitability.
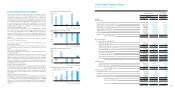
’15(actual) ’16(actual) ’17(forecast) ’18(plan) ’19(plan)
Operating income/Net incomeNet Sales
For the years ended/ending March 31
’15(actual) ’16(actual) ’17(forecast) ’18(plan) ’19(plan)
For the years ended/ending March 31
Financial Goals by the fiscal year ending March, 2019
• Consolidated sales: 120 billion JPY
• Consolidated operating profit margin: 12%
• Consolidated ROE: 20% or higher
Unit: Millions of yen Unit: Millions of yen
Other Business
Technology Solution Business
Brand Business Operating income
Net income
6,143
3,664
2,310
4,200
3,473 3,000
14,400
9,800
0
5,000
10,000
15,000
0
120,000
100,000
80,000
60,000
40,000
20,000
74,557 77,568 82,000
120,000
The target for the fiscal year ending March 2019 is maintained as we
expect Brand Business to exceed the original plan, hedging risks of the
underperformance of Technology Solution Business.
Raise profitability by significant improvement of operational efficiency and
quick decision-making through leveraging global IT Infrastructure.
Assumed foreign exchange rate: 1USD =110JPY, 1EURO = 130JPY
The financial goals in SBP-2019 were announced on April 30, 2015.
The financial forecasts in the fiscal year ending March 2017 were announced on May 11, 2016.