Wacom 2016 Annual Report Download - page 11
Download and view the complete annual report
Please find page 11 of the 2016 Wacom annual report below. You can navigate through the pages in the report by either clicking on the pages listed below, or by using the keyword search tool below to find specific information within the annual report.-
 1
1 -
 2
2 -
 3
3 -
 4
4 -
 5
5 -
 6
6 -
 7
7 -
 8
8 -
 9
9 -
 10
10 -
 11
11 -
 12
12 -
 13
13 -
 14
14 -
 15
15 -
 16
16
 |
 |

2019
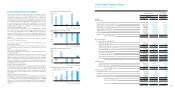
Current assets -
Cash and deposits
Notes and accounts receivable-trade
Merchandise and finished goods
Work in process
Raw materials and supplies
Deferred tax assets
Others
Allowance for doubtful accounts
Total current assets
Noncurrent assets -
Property, plant and equipment:
Buildings and structures
Accumulated depreciation
Buildings and structures, net
Machinery, equipment and vehicles
Accumulated depreciation
Machinery, equipment and vehicles, net
Tools, furniture and fixtures
Accumulated depreciation
Tools, furniture and fixtures, net
Land
Total property, plant and equipment
Intangible assets:
Software
Software in progress
Others
Total intangible assets
Investments and other assets:
Investment securities
Deferred tax assets
Others
Allowance for doubtful accounts
Total investments and other assets
Total noncurrent assets
Total assets
Wacom Co., Ltd. and its subsidiaries
Consolidated Balance Sheet
Assets:
¥16,686,619
9,875,726
7,701,8 01
400,084
2,114,966
1,229,497
2,220,080
(41,268)
40,187,505
3,382,821
(1,696,836)
1,685,985
1,104,298
(397,792)
706,506
3,937,461
(2,912,270)
1,025,191
1,190,703
4,608,385
1,823,371
3,259,519
358,946
5,441,836
587,290
55,678
654,045
(77,882)
1,219,131
11,269,352
¥51,456,857
$127,485
90,184
73,032
2,400
14,182
12,945
16,817
(929)
336,117
31,578
(15,848)
15,730
9,443
(4,152)
5,291
38,975
(30,216)
8,759
10,497
40,277
25,603
42,800
3,760
72,163
2,140
805
6,826
(690)
9,081
121,521
$457,638
March 31 March 31
Thousands of yen Thousands of
U.S. dollars
2016 20162015
¥14,365,031
10,161,958
8,229,212
270,483
1,598,066
1,458,666
1,894,900
(104,672)
37,873,644
3,558,171
(1,785,737)
1,772,434
1,064,058
(467,822)
596,236
4,391,719
(3,404,725)
986,994
1,182,748
4,538,412
2,884,895
4,822,758
423,719
8,131,372
241,167
90,677
769,109
(77,749)
1,023,204
13,692,988
¥51,566,632
Consolidated financial position
(For the years ended March 31)
0
Cash Dividends per Share / Payout Raito
’12
Cash Dividends per share(yen)
Pay out Raito(%)
10
5
’13 ’14
(Millions of yen)
(Millions of yen)
’12
(For the years ended March 31)
(For the years ended March 31)
(For the years ended March 31)
Cash flows from operating activities
Cash flows from investing activities
(Millions of yen)
Cash flows from financing activities
-1,697
’12
-1,611
’13
-4,416
-3,278
’14 ’15
-4,878
’16
’15
’15
4,881
5,895
-1,627
’13
4,337
’14
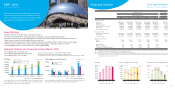
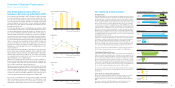
Total assets as of March 31, 2016 increased by ¥110 million to ¥51,567
million compared to the end of the previous fiscal year. The main factors
contributing to this were an increase of ¥1,062 million in software, an
increase of ¥1,563 million in software in progress, and a decrease of
¥2,322 million in cash and deposits. Total liabilities as of March 31, 2016
increased by ¥2,872 million to ¥20,470 million compared to the end of the
previous fiscal year. The main factors contributing to this were an
increase of ¥3,400 million in short-term loans payable, an increase of
¥2,000 million in long-term loans payable, and a decrease of ¥3,101 in
notes and accounts payable - trade .
Total net assets decreased by ¥2,762 million to ¥31,096 million compared
to the end of the previous fiscal year. The main contributing factors were
an increase of ¥2,310 million in net profit attributable to shareholders, a
decrease of ¥893 million in foreign currency translation adjustment, a
decrease of ¥2,999 million in the payment for shareholder’s dividends and
an increase of ¥1,121 million in treasury shares as deductions of net
assets.
As a result, the capital ratio decreased by 5.4 points to 60.0% compared
to the end of the previous fiscal year.
Consolidated cash and cash equivalents for the fiscal period ended
March 31, 2016 totaled
¥14,365 million, a ¥2,322 million decrease from the end of the previous
fiscal year. (A ¥1,293 million increase over the same previous fiscal
period)
(Cash Flow from Operating Activities)
Cash flow from operating activities during the fiscal period ended March
31, 2016 was ¥2,009
million (¥6,782 million generated in the same previous fiscal period). The
main factors contributing to cash inflow were an increase of ¥3,597
million in income before income taxes and minority, an increase of ¥2,004
million in depreciation, and an increase of ¥422 million in provision for
bonuses. The main factors contributing to cash outflow were a decrease
of ¥2,781 million in notes and accounts payable – trade and a decrease of
¥1,635 million in income taxes paid.
(Cash Flow from Investing Activities)
Cash flow from investing activities during the fiscal period ended March
31, 2016 was ¥4,878 million (compared to ¥3,278 million used in the previ-
ous comparable period). The primary contributing factors were a ¥1,167
million purchase of tangible assets such as equipment, and a ¥3,295
million purchase of system software and other such items for the global IT
infrastructure.
(Cash Flow from Financing Activities)
Cash flow from financing activities during the fiscal period ended March
31, 2016 was ¥1,209 million (compared to ¥2,850 million used in the previ-
ous comparable period). The primary contributing factor were a ¥5,400
million income from short-term loans payable, ¥1,245 million payment for
treasury stock acquisition, and a ¥2,992 million payment for shareholders’
dividends.
’12 ’13
734
6,782
’14 ’15
2,009
’16
0
-1,000
-2,000
-3,000
-4,000
-5,000
-4,000
-3,000
-2,000
-1,000
0
1,000
2,000
3,000
4,000
5,000
-3,255 -2,850
’16
1,209
54.9
37.7
11. 25
15
20 17.50 18.0
86.3
7.5 0
55.9
0
1,000
2,000
3,000
4,000
5,000
6,000
7,0 0 0
’16
18.0
128.6
60
90
120
150