Wacom 2016 Annual Report Download - page 10
Download and view the complete annual report
Please find page 10 of the 2016 Wacom annual report below. You can navigate through the pages in the report by either clicking on the pages listed below, or by using the keyword search tool below to find specific information within the annual report.-
 1
1 -
 2
2 -
 3
3 -
 4
4 -
 5
5 -
 6
6 -
 7
7 -
 8
8 -
 9
9 -
 10
10 -
 11
11 -
 12
12 -
 13
13 -
 14
14 -
 15
15 -
 16
16
 |
 |

1817
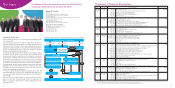
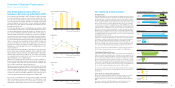
Our results by business sector
Brand business
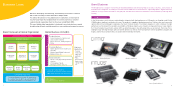
In the Creative Business, sales of Pen tablets exceeded the previous fiscal year
owing to a significant increase in sales of Intuos in the Chinese market, as well
as favorable sales of new Intuos products released in September. In Mobile
products, Cintiq Companion 2, launched previous fiscal year, continued to
receive positive market reception. Overall sales greatly exceeded the same
period of the previous fiscal year. In Display products, at the end of the previ-
ous fiscal year we launched our flagship models, Cintiq 27QHD series, which
sold well and opened up a new market of production tools for 3D works. The
other lineups also contributed to an increase in overall sales compared to the
previous fiscal year. In Consumer products, to open up a new category of
digital stationery, in September we launched our new product, Bamboo Spark,
which digitalizes handwritten notes on paper to enable data sharing via cloud
computing and has been selling strongly. As a result, overall sales significantly
exceeded the previous fiscal year.
In the Business Solution, overall sales were below the previous fiscal year,
mainly due to a strong yen against the euro, a decrease in sales in Europe as a
consequence of large-scale deals in the previous fiscal year, and a postpone-
ment of capital investment driven by uncertainties in the global economy.
By region, overall sales exceeded the previous fiscal year in Japan, the U.S.,
Europe, Asia and Oceania, owing to steady sales of Creative Business prod-
ucts, especially in China with the rapid expansion in digital content creation.
As a result, overall sales in the Brand Business segment increased 12.2% to
¥48,931 million, and operating income increased 34.7% to ¥8,036 million.
Technology Solution Business
In pen sensor systems for tablets, a large-scale order from the government of
Turkey for an educational tablet project contributed to sales expansion. We
also increased the commercial production of our Active-ES pen sensor system.
These factors supported an increase in overall sales compared to the same
period of the previous fiscal year. However, in pen sensor systems for smart-
phones, overall sales fell below the previous fiscal year due to smaller orders
for Samsung’ s new Galaxy Note 5 compared with their previous model. Also in
pen sensor systems for notebook PCs, overall sales decreased dramatically
due to a shift in demand for digital pens from notebook PCs to tablets.
As a result, overall sales in the Technology Solution Business segment
decreased 7.6% to ¥27,974 million, and operating income decreased 32.6% to
¥3,130 million.
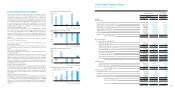
Other Business (Engineering Solution)
Overall sales slightly exceeded the previous fiscal year owing to a recovery in
demand for replacements in response to the termination of Windows XP
support, and the launch of the new products ECAD dio DCX R2 and ECAD dio
2016.
As a result, overall sales in the Other Business segment increased 1.2% to
¥663 million, and operating income decreased 35.1% to ¥36 million.
48,931’16
43,625’15
(For the years ended March 31)
(For the years ended March 31)
(Millions of yen)
(For the years ended March 31)
(Millions of yen)
Sales
Operating
income
Brand Business
UP 12.2%
UP 34.7%
8,036’16
5,965’15
Operating
income
Operating
income
3,130’16
4,642’15
27,974’16
30,227’15
Sales
Technology Solution Business
DOWN 7.6%
DOWN 32.6%
663’16
655’15
Sales
Other Business
UP 1.2%
DOWN 35.1%
36’16
55’15
Technology Solution Business 40.6%
(For the years ended March 31)
(Millions of yen)
Sales Breakdown by Business
Brand Business 58.5%
Other Business 0.9%
Technology Solution Business 36.1%
Brand Business 63.1%
Other Business 0.8%
2016
¥77,568
2015
¥74,557
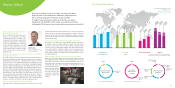
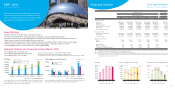
Overview of Business Performance
How did the global economy effect our
business in the fiscal year ended March 2016?
Wacom Co., Ltd. and its subsidiaries
In the current fiscal year (April 1, 2015 to March 31, 2016), the global
economy maintained a slow recovery, mainly in developed coun-
tries. Since the fourth quarter, however, uncertainties in the global
economy have been increasing, driven by a worsening situation with
unsolved refugees issues in Europe. The yen strengthened against
the dollar in the fourth quarter. It remained strong against the euro
throughout the fiscal year.
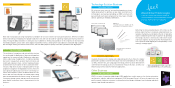
In the Creative Business area in our Brand Business segment, digital
content creation for the movie, comic and game application sectors
has been expanding into emerging countries. In developed coun-
tries, we are seeing the spread of interest in 3D content, which is
directing significant attention to digital pens. In the Consumer Busi-
ness area, we have opened up a new digital stationery market,
featuring a product that can harmonize analog and digital informa-
tion, transforming hand-written analog ideas on paper into digital
data on screen via cloud computing, ready for editing, sharing, and
storing. In the Business Solution area, demand for cost-effective
paperless procedures and improved digital signature security is
growing across a broad range of sectors, including medicine, edu-
cation and finance.
In the Technology Solution Business segment, the high-end smart-
phone market saw a slowdown, leading to fierce competition and a
rapid change in industry structure. The tablet market continued to
stagnate due to weak sales of Android OS. The notebook PC market
also experienced slow sales due to factors such as an increasing
shift in demand to a ‘2 in 1’ tablet market.
Against this background, Wacom Group has further solidified its
position as a global leader and pursued investment strategies not
only to expand our product line-up in each business segment, but
also to enhance the Group’s future business base.
We have focused on restructuring the global supply chain and
developing global IT infrastructures from a long-term perspective in
response to rapid globalization and e-commercialization. Simultane-
ously, in order to pursue growth in our global business, we shifted
our previous region-based Global Business Unit structure into a
customer segment-based global organization from April 2015.
As a result, consolidated net sales increased 4.0% to ¥77,568
million, operating income decreased 40.3% to ¥3,664 million, ordi-
nary income decreased 37.7% to ¥3,777 million, and net profit
attributable to shareholders decreased 33.5% to ¥2,310 million.
0
10
5
15
20
25
30
0
5
10
15
20
25
30
40
50
60
70
80
(Yen)
’12
(For the years ended March 31)
Net income per share (basic)
ROE/ROA
Equity ratio
13.66
’13
29.81
’14
31.31
’15 ’16
20.86
14.00
11.7
7.1
Note: ROA equals net income/average total assets.
55.2 58.1
(ROE)
(ROA)
19.9
11.3
(%)
’12
(For the years ended March 31)
’13 ’14 ’15
(%)
(For the years ended March 31)
’12 ’13
64.2
’14
65.4
’15
60.0
’16
6.8
10.5
’16
4.5
7.1
17.0
10.4