Wacom 2016 Annual Report Download - page 12
Download and view the complete annual report
Please find page 12 of the 2016 Wacom annual report below. You can navigate through the pages in the report by either clicking on the pages listed below, or by using the keyword search tool below to find specific information within the annual report.-
 1
1 -
 2
2 -
 3
3 -
 4
4 -
 5
5 -
 6
6 -
 7
7 -
 8
8 -
 9
9 -
 10
10 -
 11
11 -
 12
12 -
 13
13 -
 14
14 -
 15
15 -
 16
16
 |
 |

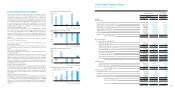
Net sales
Cost of sales
Gross profit
Selling, general and administrative expenses
Operating income
Non-operating income:
Interest income
Dividends income
Rent income
Others
Total non-operating income
Non-operating expenses:
Interest expenses
Foreign exchange losses
Commission fee
Others
Total non-operating expenses
Ordinary income
Extraordinary income:
Gain on sales of property, plant and equipment
Gain on reversal of subscription rights to shares
Other
Total extraordinary income
Extraordinary loss:
Impairment loss
Loss on sales of property, plant and equipment
Loss on retirement of property, plant and equipment
Loss on sales of investment securities
Loss on valuation of investment securities
Business structure improvement expenses
Others
Total extraordinary losses
Income before income taxes
Income taxes-current
Income taxes-deferred
Total income taxes
Income before minority interests
Net income
21 22
Consolidated Statements of Income
Wacom Co., Ltd. and Its Subsidiaries
$688,392
415,620
272,772
240,252
32,520
685
305
537
650
2,177
197
465
227
294
1,182
33,515
19
258
-
277
425
34
119
200
-
1,063
25
1,866
31,927
11,086
344
11,430
20,496
$20,496
Thousands of yen Thousands of
U.S. dollars
2016 20162015
Years ended March 31
Year ended March 31
¥74,557,460
44,507,160
30,050,300
23,907,631
6,142,669
59,772
-
9,294
48,514
117,580
9,652
168,004
-
17,981
195,637
6,064,612
1,894
6,792
21
8,707
-
461,483
11,8 02
9,179
316,170
167,286
704
966,624
5,106,695
1,126,549
507,002
1,633,551
3,473,144
¥3,473,144
¥77,568,014
46,832,029
30,735,985
27,071,623
3,664,362
77,210
34,364
60,474
73,276
245,324
22,176
52,340
25,532
33,129
133,177
3,776,509
2,100
29,115
-
31,215
47,933
3,810
13,456
22,507
-
119,739
2,790
210,235
3,597,489
1,249,177
38,798
1,287,975
2,309,514
¥2,309,514
Liabilities:
Current liabilities -
Notes and accounts payable-trade
Short-term loans payable
Accrued expenses
Income taxes payable
Provision for bonuses
Provision for directors' and statutory corporate auditors' bonuses
Others
Total current liabilities
Noncurrent liabilities -
Long-term loans payable
Deferred tax liabilities
Net defined benefit liability
Provision for bonuses
Asset retirement obligations
Others
Total noncurrent liabilities
Total liabilities
Net Assets:
Shareholders' equity -
Capital stock
Capital surplus
Retained earnings
Treasury stock
Total shareholders' equity
Accumulated other comprehensive income -
Valuation difference on available-for-sale securities
Foreign currency translation adjustment
Remeasurements of defined benefit plans
Total accumulated other comprehensive income
Subscription rights to shares -
Total net assets
Total liabilities and net assets
March 31 March 31
Thousands of yen Thousands of
U.S. dollars
2016 20162015
¥6,102,787
4,000,000
2,884,408
271,839
941,847
9,787
2,267,964
16,478,632
2,000,000
545,983
868,560
7,48 4
153,996
415,581
3,991,604
20,470,236
4,203,469
7,513,373
21,629,469
(2,576,159)
30,770,152
40,431
175,342
(27,392)
188,381
137,863
31,096,396
¥51,566,632
¥9,203,455
600,000
2,605,243
613,674
545,810
59,270
2,252,775
15,880,227
-
206,397
813,059
-
152,845
545,359
1,717,660
17,597,887
4,203,469
7,5 50 ,743
22,318,906
(1,455,137)
32,617,981
27,370
1,068,558
(35,573)
1,060,355
180,634
33,858,970
¥51,456,857
$54,160
35,499
25,598
2,412
8,359
87
20,127
146,243
17,749
4,845
7,70 8
66
1,367
3,688
35,424
181,667
37,304
66,679
191,955
(22,863)
273,076
359
1,556
(243)
1,672
1,223
275,971
$457,638