Wacom 2016 Annual Report Download - page 14
Download and view the complete annual report
Please find page 14 of the 2016 Wacom annual report below. You can navigate through the pages in the report by either clicking on the pages listed below, or by using the keyword search tool below to find specific information within the annual report.-
 1
1 -
2
-
3
-
 4
4 -
 5
5 -
 6
6 -
 7
7 -
 8
8 -
 9
9 -
 10
10 -
 11
11 -
 12
12 -
 13
13 -
 14
14 -
 15
15 -
 16
16
 |
 |

25 26
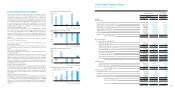
Consolidated Statements of Cash Flows
Wacom Co., Ltd. and Its Subsidiaries
Net cash provided by (used in) operating activities:
Income before income taxes
Depreciation and amortization
Share-based compensation expenses
Increase (decrease) in allowance for doubtful accounts
Increase (decrease) in provision for bonuses
Increase (decrease) in provision for directors' bonuses
Increase (decrease) in net defined benefit liability
Interest and dividends income
Interest expenses
Foreign exchange losses (gains)
Loss (gain) on sales of property, plant and equipment
Loss on retirement of property, plant and equipment
Loss (gain) on sales of investment securities
Loss (gain) on valuation of investment securities
Decrease (increase) in notes and accounts receivable-trade
Decrease (increase) in inventories
Increase (decrease) in notes and accounts payable-trade
Others, net
Sub total
Interest and dividends income received
Interest expenses paid
Income taxes paid
Net cash provided by (used in) operating activities
Net cash provided by (used in) investing activities:
Purchase of property, plant and equipment
Purchase of intangible assets
Purchase of software
Proceeds from sales of property, plant and equipment
Proceeds from sales of investment securities
Acquisitions of Business
Payments for lease and guarantee deposits
Proceeds from collection of lease and guarantee deposits
Other, net
Net cash provided by (used in) investing activities
Net cash provided by (used in) financing activities:
Increase in short-term loans payable
Decrease in short-term loans payable
Proceeds from long-term loans payable
Purchase of treasury stock
Proceeds from disposal of treasury stock
Cash dividends paid
Net cash provided by (used in) financing activities
Effect of exchange rate change on cash and cash equivalents
Net increase (decrease) in cash and cash equivalents
Cash and cash equivalents at beginning of year
Cash and cash equivalents at end of year
Thousands of yen Thousands of
U.S. dollars
2016 20162015
Years ended March 31
Year ended March 31
¥3,597,489
2,003,718
1,116
69,740
422,113
(49,559)
68,725
(111,574)
22,176
221,012
1,711
13,456
22,507
-
(456,313)
(342,300)
(2,780,336)
851,354
3,555,035
111,064
(21,957)
(1,634,978)
2,009,164
(1,166,777)
(108,549)
(3,924,963)
53,959
352,120
-
(98,645)
14,731
-
(4,878,124)
5,400,000
(2,000,000)
2,000,000
(1,244,532)
45,563
(2,991,749)
1,209,282
(661,910)
(2,321,588)
16,686,619
¥14,365,031
5,106,695
1,970,162
54,959
46,405
51,049
(1,765)
83,402
(59,772)
9,652
(228,194)
459,589
11,802
9,179
316,170
1,804,282
(545,826)
(590,219)
693,184
9,190,754
57,879
(9,642)
(2,456,758)
6,782,233
(762,060)
-
(2,576,225)
247,326
84,643
(274,321)
(3,604)
6,302
175
(3,277,764)
2,000,000
(2,000,000)
-
-
55,066
(2,904,584)
(2,849,518)
637,729
1,292,680
15,393,939
16,686,619
$31,927
17,782
10
619
3,746
(440)
610
(990)
197
1,961
15
119
200
-
(4,050)
(3,038)
(24,675)
7,556
31,550
986
(195)
(14,510)
17,831
(10,355)
(963)
(34,833)
479
3,125
-
(875)
131
-
(43,292)
47,923
(17,749)
17,749
(11,045)
404
(26,551)
10,732
(5,874)
(20,603)
148,089
$127,485
Treasury shares Total shareholders'
equity
Capital stock Capital surplus Retained earnings
Valuation difference
on available-for-
sales Securities
Foreign currency
translation
adjustment
Remaeasurements
of defined benefit
plans
Total accumulated
other comprehensive
income
Stock
acquisition
right
Total net assets
Shareholders' equity
Thousands of U.S. dollars
$37,304
$37,304
$67,010
(332)
$66,678
$198,073
(26,615)
20,496
$191,954
($12,914)
(10,818)
870
($22,862)
$289,473
(26,615)
20,496
(10,818)
538
$273,074
Balance at March 31,2015
Dividends from surplus
Net income
Purchase of treasury stock
Disposal of treasury stock
Net changes of items other than
shareholders' equity
Balance at March 31,2016
($316)
73
($243)
$1,603
(380)
$1,223
Accumulated other comprehensive income
$243
116
$359
$9,483
(7,927)
$1,556
Balance at March 31,2015
Dividends from surplus
Net income
Purchase of treasury stock
Disposal of treasury stock
Net changes of items other than
shareholders' equity
Balance at March 31,2016
$9,410
(7,738)
$1,672
$300,486
(26,615)
20,496
(10,818)
538
(8,118)
$275,969