Wacom 2016 Annual Report Download - page 13
Download and view the complete annual report
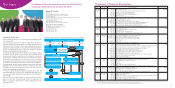
Please find page 13 of the 2016 Wacom annual report below. You can navigate through the pages in the report by either clicking on the pages listed below, or by using the keyword search tool below to find specific information within the annual report.-
 1
1 -
2
-
 3
3 -
 4
4 -
 5
5 -
 6
6 -
 7
7 -
 8
8 -
 9
9 -
 10
10 -
 11
11 -
 12
12 -
 13
13 -
 14
14 -
 15
15 -
 16
16
 |
 |

Shareholders' equity
Treasury shares Total shareholders'
equity
Thousands of yen
Capital stock Capital surplus Retained earnings
¥4,203,469
4,203,469
4,203,469
¥4,203,469
¥7,563,702
¥7,563,702
(12,959)
7,5 50 ,743
(37,370)
¥7,513,373
¥21,710,864
¥48,095
¥21,758,959
(2,913,197)
3,473,144
22,318,906
(2,998,951)
2,309,514
¥21,629,469
(¥1,538,697)
(¥1,538,697)
83,560
(1,455,137)
(1,219,000)
97,978
(¥2,576,159)
¥31,939,338
¥48,095
¥31,987,433
(2,913,197)
3,473,144
-
70,601
32,617,981
(2,998,951)
2,309,514
(1,219,000)
60,608
¥30,770,152
Balance at April 1,2014
Cumulative effects of changes in accounting policies
Restated balance
Dividends from surplus
Net income
Purchase of treasury stock
Disposal of treasury stock
Net changes of items other than
shareholders' equity
Balance at March 31,2015
Dividends from surplus
Net income
Purchase of treasury stock
Disposal of treasury stock
Net changes of items other than
shareholders' equity
Balance at March 31,2016
Valuation difference
on available-for-
sales Securities
Foreign currency
translation
adjustment
Remaeasurements
of defined benefit
plans
Total accumulated
other comprehensive
income
Stock
acquisition
right
Total net assets
Accumulated other comprehensive income
23 24
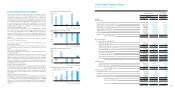
Consolidated Statements of Changes in Net Assets
Wacom Co., Ltd. and Its Subsidiaries
Balance at April 1,2014
Cumulative effects of changes in accounting policies
Restated balance
Dividends from surplus
Net income
Purchase of treasury stock
Disposal of treasury stock
Net changes of items other than
shareholders' equity
Balance at March 31,2015
Dividends from surplus
Net income
Purchase of treasury stock
Disposal of treasury stock
Net changes of items other than
shareholders' equity
Balance at March 31,2016
(¥27,772)
(¥27,772)
(7,801)
(35,573)
8,181
(¥27,392)
¥712,154
¥712,154
348,201
1,060,355
(871,974)
¥188,381
¥147,836
¥147,836
32,798
180,634
(42,771)
¥137,863
¥32,799,328
¥48,095
¥32,847,423
(2,913,197)
3,473,144
-
70,601
380,999
33,858,970
(2,998,951)
2,309,514
(1,219,000)
60,608
(914,745)
¥31,096,396
¥416,116
¥416,116
(388,746)
27,370
13,061
¥40,431
¥323,810
¥323,810
744,748
1,068,558
(893,216)
¥175,342
Income before minority interests
Other comprehensive income
Valuation difference on available-for-sale securities
Foreign currency translation adjustment
Remeasurements of defined benefit plans, net of tax
Total other comprehensive income
Comprehensive income
(Comprehensive income attributable to)
Comprehensive income attributable to owners of the Company
Comprehensive income attributable to minority interests
¥2,309,514
13,061
(893,216)
8,181
(871,974)
1,437,540
1,437,540
-
¥3,473,144
(388,746)
744,748
(7,801)
348,201
3,821,345
3,821,345
-
$20,496
116
(7,927)
73
(7,738)
12,758
12,758
-
Wacom Co., Ltd. and Its Subsidiaries
Consolidated Statements of Comprehensive Income
Thousands of yen Thousands of
U.S. dollars
2016 20162015
Years ended March 31
Year ended March 31