Vistaprint 2015 Annual Report Download - page 2
Download and view the complete annual report
Please find page 2 of the 2015 Vistaprint annual report below. You can navigate through the pages in the report by either clicking on the pages listed below, or by using the keyword search tool below to find specific information within the annual report.-
 1
1 -
 2
2 -
 3
3 -
 4
4 -
 5
5 -
 6
6 -
 7
7 -
 8
8 -
 9
9 -
 10
10 -
 11
11 -
 12
12 -
 13
13 -
14
-
15
-
16
-
17
-
18
-
19
-
20
-
21
-
22
-
23
-
24
-
25
-
26
-
27
-
28
-
29
-
30
-
31
-
32
-
33
-
34
-
35
-
36
-
37
-
38
-
39
-
40
-
41
-
42
-
43
-
44
-
45
-
46
-
47
-
48
-
49
-
50
-
51
-
52
-
53
-
54
-
55
-
56
-
57
-
58
-
59
-
60
-
61
-
62
-
63
-
64
-
65
-
66
-
67
-
68
-
69
-
70
-
71
-
72
-
73
-
74
-
75
-
76
-
77
-
78
-
79
-
80
-
81
-
82
-
83
-
84
-
85
-
86
-
87
-
88
-
89
-
90
-
91
-
92
-
93
-
94
-
95
-
96
-
97
-
98
-
99
-
100
-
101
-
102
-
103
-
104
-
105
-
106
-
107
-
108
-
109
-
110
-
111
-
112
-
113
-
114
-
115
-
116
-
117
-
118
-
119
-
120
-
121
-
122
-
123
-
124
-
125
-
126
-
127
-
128
-
129
-
130
-
131
-
132
-
133
-
134
-
135
-
136
-
137
-
138
-
139
-
140
-
141
-
142
-
143
-
144
-
145
-
146
-
147
-
148
-
149
-
150
-
151
-
152
-
153
-
154
-
155
-
156
-
157
-
158
-
159
-
160
 |
 |

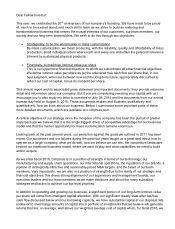
$0.45
$0.60
$0.87
$1.25
$1.49
$1.83
$0.85
$1.28
$2.73
$1.13
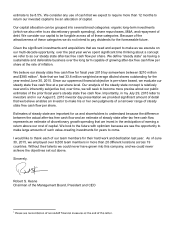
$(13)
$7
$18
$37
$46
$119
$53
$66
$144
$89
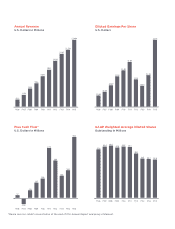
Annual Revenue
U.S. Dollars in Millions
Diluted Earnings Per Share
U.S. Dollars
Free Cash Flow*
U.S. Dollars in Millions
FY07
FY06 FY08 FY09 FY10 FY11 FY12 FY13 FY14 FY15
FY07
FY06 FY08 FY09 FY10 FY11 FY12 FY13 FY14 FY15
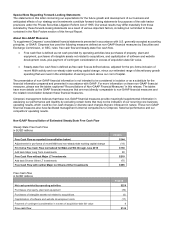
45.4
42.6
46.0
44.6 45.3 45.0
34.5 34.2 33.8
39.0
GAAP Weighted Average Diluted Shares
Outstanding in Millions
FY07
FY06 FY08 FY09 FY10 FY11 FY12 FY13 FY14 FY15
FY07
FY06 FY08 FY09 FY10 FY11 FY12 FY13 FY14 FY15
$256
$152
$401
$516
$670
$817
$1,020
$1,167
$1,270
$1,494
*Please see non-GAAP reconciliation at the end of this Annual Report and proxy statement.