United Healthcare 2002 Annual Report Download - page 21
Download and view the complete annual report
Please find page 21 of the 2002 United Healthcare annual report below. You can navigate through the pages in the report by either clicking on the pages listed below, or by using the keyword search tool below to find specific information within the annual report.
{ 20 }
UnitedHealth Group
2002 FINANCIAL PERFORMANCE HIGHLIGHTS
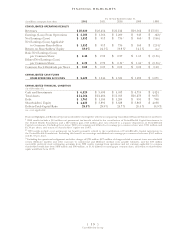
2002 was a record year for UnitedHealth Group as the company continued strong diversified growth
across its business segments and realized diluted net earnings per common share of $4.25, up 52% over
2001 on a reported basis and up 38% on a FAS No. 142 comparable reporting basis.1Other financial
performance highlights include:
>Revenues of $25.0 billion, a 7% increase over 2001.
>Operating earnings of $2.2 billion, up 40% over 2001 on a reported basis and up 32% on a
FAS No. 142 comparable reporting basis.
>Net earnings of nearly $1.4 billion, a 48% increase over 2001 on a reported basis and a 35% increase
on a FAS No. 142 comparable reporting basis.
>Operating cash flows of more than $2.4 billion, an increase of 31% over 2001.
>Consolidated operating margin of 8.7%, up from 6.7% in 2001 on a reported basis and up from
7.1% on a FAS No. 142 comparable reporting basis, driven by operational and productivity
improvements, improved margins on risk-based products, and a product mix shift from risk-based
products to higher-margin, fee-based products.
>Return on shareholders’ equity of 33.0%, up from 24.5% in 2001 on a reported basis and up from
26.8% on a FAS No. 142 comparable reporting basis.
2002 RESULTS COMPARED TO 2001 RESULTS
CONSOLIDATED FINANCIAL RESULTS
Revenues
Revenues are comprised of premium revenues from risk-based products; service revenues, which
primarily include fees for management, administrative and consulting services; and investment and
other income.
Premium revenues are derived from risk-based arrangements in which the premium is fixed, typically for
a one-year period, and we assume the economic risk of funding health care services and related administrative
costs. Service revenues consist primarily of fees derived from services performed for customers that self-insure
the medical costs of their employees and their dependents. For both premium risk-based and fee-based
customer arrangements, we provide coordination and facilitation of medical services, transaction processing,
customer, consumer and care provider services, and access to contracted networks of physicians, hospitals and
other health care professionals.
Consolidated revenues increased by approximately $1.6 billion, or 7%, in 2002 to $25.0 billion.
Strong growth across our business segments was partially offset by the impact of targeted withdrawals
from unprofitable risk-based arrangements with customers using multiple health benefit carriers, and
withdrawals and benefit design changes in our Medicare+Choice product offering in certain markets.
RESULTS OF OPERATIONS
1On January 1, 2002, UnitedHealth Group adopted Statement of Financial Accounting Standards (FAS) No. 142, “Goodwill and
Other Intangible Assets,” which eliminated the amortization of goodwill. To enhance analysis, the FAS No. 142 comparable reporting
basis excludes $93 million ($89 million after tax effect) of goodwill amortization from 2001 results.


