United Healthcare 2002 Annual Report Download - page 20
Download and view the complete annual report
Please find page 20 of the 2002 United Healthcare annual report below. You can navigate through the pages in the report by either clicking on the pages listed below, or by using the keyword search tool below to find specific information within the annual report.-
 1
1 -
2
-
3
-
4
-
5
-
6
-
7
-
8
-
9
-
 10
10 -
 11
11 -
 12
12 -
 13
13 -
 14
14 -
 15
15 -
 16
16 -
 17
17 -
 18
18 -
 19
19 -
 20
20 -
 21
21 -
 22
22 -
 23
23 -
 24
24 -
 25
25 -
 26
26 -
 27
27 -
 28
28 -
 29
29 -
 30
30 -
31
-
32
-
33
-
34
-
35
-
36
-
37
-
38
-
39
-
40
-
41
-
42
-
43
-
44
-
45
-
46
-
47
-
48
-
49
-
50
-
51
-
52
-
53
-
54
-
55
-
56
-
57
-
58
-
59
-
60
-
61
-
62
-
63
-
64
-
65
-
66
-
67
 |
 |

{ 19 }
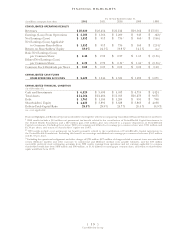
UnitedHealth Group
For the Year Ended December 31,
(in millions, except per share data) 2002 2001 2000 1999 1998
CONSOLIDATED OPERATING RESULTS
Revenues $ 25,020 $23,454 $21,122 $19,562 $17,355
Earnings (Loss) From Operations $ 2,186 $1,566 $1,200 $943 $(42)
3
Net Earnings (Loss) $ 1,352 $913 $736
1
$568
2
$(166)
Net Earnings (Loss) Applicable
to Common Shareholders $ 1,352 $913 $736 $568 $(214)
3
Return on Shareholders’ Equity 33.0 % 24.5 % 19.8 %
1
14.1 % na
3
Basic Net Earnings (Loss)
per Common Share $ 4.46 $2.92 $2.27 $1.63 $(0.56)
Diluted Net Earnings (Loss)
per Common Share $ 4.25 $2.79 $2.19
1
$1.60
2
$(0.56)
3
Common Stock Dividends per Share $ 0.03 $0.03 $0.02 $0.02 $0.02
CONSOLIDATED CASH FLOWS
FROM OPERATING ACTIVITIES
$ 2,423 $1,844 $1,521 $1,189 $1,071
CONSOLIDATED FINANCIAL CONDITION
(As of December 31)
Cash and Investments $ 6,329 $5,698 $5,053 $4,719 $4,424
Total Assets $ 14,164 $12,486 $11,053 $10,273 $9,675
Debt $ 1,761 $1,584 $1,209 $991 $708
Shareholders’ Equity $ 4,428 $3,891 $3,688 $3,863 $4,038
Debt-to-Total-Capital Ratio 28.5 % 28.9 % 24.7% 20.4 % 14.9 %
na – not applicable
Financial Highlights and Results of Operations should be read together with the accompanying Consolidated Financial Statements and Notes.
12000 results include a $14 million net permanent tax benefit related to the contribution of UnitedHealth Capital investments to
the United Health Foundation and a $27 million gain ($17 million after tax) related to a separate disposition of UnitedHealth
Capital investments. Excluding these items, 2000 net earnings and diluted net earnings per common share were $705 million and
$2.10 per share, and return on shareholders’ equity was 19.0%.
21999 results include a net permanent tax benefit primarily related to the contribution of UnitedHealth Capital investments to
the United Health Foundation. Excluding this benefit, net earnings and diluted net earnings per common share were $563 million
and $1.59 per share.
3Excluding the operational realignment and other charges of $725 million, $175 million of charges related to contract losses associated with
certain Medicare markets and other increases to commercial and Medicare medical costs payable estimates, and the $20 million
convertible preferred stock redemption premium from 1998 results, earnings from operations and net earnings applicable to common
shareholders would have been $858 million and $509 million, or $1.31 diluted net earnings per common share, and return on shareholders'
equity would have been 11.9%.
FINANCIAL HIGHLIGHTS