Ubisoft 2016 Annual Report Download - page 18
Download and view the complete annual report
Please find page 18 of the 2016 Ubisoft annual report below. You can navigate through the pages in the report by either clicking on the pages listed below, or by using the keyword search tool below to find specific information within the annual report.-
 1
1 -
2
-
3
-
4
-
5
-
6
-
7
-
 8
8 -
 9
9 -
 10
10 -
 11
11 -
 12
12 -
 13
13 -
 14
14 -
 15
15 -
 16
16 -
 17
17 -
 18
18 -
 19
19 -
 20
20 -
 21
21 -
 22
22 -
 23
23 -
 24
24 -
 25
25 -
 26
26 -
 27
27 -
 28
28 -
29
-
30
-
31
-
32
-
33
-
34
-
35
-
36
-
37
-
38
-
39
-
40
-
41
-
42
-
43
-
44
-
45
-
46
-
47
-
48
-
49
-
50
-
51
-
52
-
53
-
54
-
55
-
56
-
57
-
58
-
59
-
60
-
61
-
62
-
63
-
64
-
65
-
66
-
67
-
68
-
69
-
70
-
71
-
72
-
73
-
74
-
75
-
76
-
77
-
78
-
79
-
80
-
81
-
82
-
83
-
84
-
85
-
86
-
87
-
88
-
89
-
90
-
91
-
92
-
93
-
94
-
95
-
96
-
97
-
98
-
99
-
100
-
101
-
102
-
103
-
104
-
105
-
106
-
107
-
108
-
109
-
110
-
111
-
112
-
113
-
114
-
115
-
116
-
117
-
118
-
119
-
120
-
121
-
122
-
123
-
124
-
125
-
126
-
127
-
128
-
129
-
130
-
131
-
132
-
133
-
134
-
135
-
136
-
137
-
138
-
139
-
140
-
141
-
142
-
143
-
144
-
145
-
146
-
147
-
148
-
149
-
150
-
151
-
152
-
153
-
154
-
155
-
156
-
157
-
158
-
159
-
160
-
161
-
162
-
163
-
164
-
165
-
166
-
167
-
168
-
169
-
170
-
171
-
172
-
173
-
174
-
175
-
176
-
177
-
178
-
179
-
180
-
181
-
182
-
183
-
184
-
185
-
186
-
187
-
188
-
189
-
190
-
191
-
192
-
193
-
194
-
195
-
196
-
197
-
198
-
199
-
200
-
201
-
202
-
203
-
204
-
205
-
206
-
207
-
208
-
209
-
210
-
211
-
212
-
213
-
214
-
215
-
216
 |
 |

Group presentation
22015/2016 fi nancial year
Gross profi t as a percentage of sales grew to 78.1% and fell, in
absolute terms, to €1,088.9 million compared with a gross profi t
of 77.0% (€1,126.7 million) in 2014/2015.
Non-IFRS current operating profi t stood at €169.0 million, above the
revised target of €150 million. This compares to a non-IFRS current
operating profi t of €170.5 million in 2014/2015.
The change in non-IFRS current operating profi t breaks down as
follows:
♦ drop of €37.8 million in gross profi t;
♦
drop of €73.2 million in R&D costs to reach €500.3 million
(35.9% of sales), compared with €573.5 million for the 2014/2015
fi nancial year (39.2%). The drop was mainly due to the launch of
5 AAA titles in 2014/2015 (including Assassin’s Creed® Rogue)
compared to 4 in 2015/2016, as well as to the launch of two titles
at the end of the fi nancial year (Tom Clancy’s The Division and
Far Cry Primal);
♦
increase of €36.9 million in SG&A costs to €419.6 million (30.1%
of sales), compared with €382.7 million (26.1%) the previous year:
•
variable marketing expenses stood at €217.3 million (15.6%
of sales) compared with €206.1 million (14.1%) in 2014/2015,
which had benefi ted from the commitment of a portion of
marketing expenditure for Watch Dogs in 2013/2014,
•
structure costs totaled €202.2 million (14.5% of sales), compared
with €176.6 million (12.1%) in 2014/2015, one third of the rise
being due to the exchange rate impact.
Non-IFRS net profi t totaled €129 million, corresponding to a non-
IFRS net profi t per share (diluted) of €1.13, compared with a non-
IFRS net profi t of €112.6 million for 2014/2015 or €1.00 per share.
The IFRS net profi t totaled €93.4 million, corresponding to an
IFRS net profi t per share (diluted) of €0.82, compared with an
IFRS net profi t of €86.8 million and an IFRS net profi t per share
(diluted) of €0.77 in 2014/2015.
The average IFRS tax rate was 24% due to recognition of future
changes in French corporation tax on temporary tax differences.
❙ 2.5.3 CHANGE IN WCR AND DEBT LEVELS
Based on the non-IFRS cash fl ow statement, the working capital
requirement was up €253.3 million compared with a drop of
€59 million the previous fi nancial year. The main changes related to:
♦ assets side: rise in trade receivables (€403 million) and other
assets (€30 million);
♦ liabilities side: rise in trade payables (€117 million) and other
liabilities (€63 million).
The increase in trade receivables and trade payables was largely due
to games launched in Q4 of the fi nancial year with Far Cry Primal
and Tom Clancy’s The Division, compared with the same period
the previous fi nancial year when no games were launched. The
increase in other assets and other liabilities relates to the high level
of business in the fi nal quarter resulting in signifi cant receivables
and tax liabilities and the recognition of substantial deferred income.
The use of cash flows from operating activities stood at
€(148.8) million (compared with generation of €232.4 million in
2014/2015). This refl ects cash fl ows from operating activities of
€104.5 million (compared with €173.5 million for 2014/2015) and
the increase in WCR of €253.3 million. Free cash fl ow before WCR
was €61.8 million.
Net borrowing at March 31, 2016 was €(41.7) million compared
with net cash of €211.3 million at March 31, 2015, the Company
having bought back €79.3 million in shares over the fi nancial year
(3,488,214 shares).
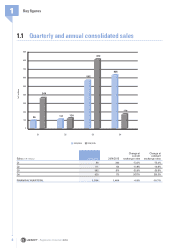
(in €thousands) 03/31/16 03/31/15*
Sales 1,393,997 1,463,753
Gross profi t 1,088,932 1,126,680
R&D costs (500,337) (573,533)
SG&A costs (419,555) (382,688)
Non-IFRScurrent operating income 169,040 170,459
Stock-based compensation (12,918) (9,609)
Other non-current operating income and expenses (9,334) (21,717)
Operating profi t (loss) 136,788 139,133
Net financial income (13,726) 712
Income tax (credit) (29,654) (52,996)
PROFIT (LOSS) FOR THE PERIOD ATTRIBUTABLE TO THE OWNERS OF THE PARENT 93,408 86,849
Equity 1,018,510 979,220
Investment expenditure on internal and external game production 586,840 537,287
Staff 10,667 9,790
* Restated for the impacts of IFRIC21
- Registration Document 2016
16