U-Haul 2008 Annual Report Download - page 31
Download and view the complete annual report
Please find page 31 of the 2008 U-Haul annual report below. You can navigate through the pages in the report by either clicking on the pages listed below, or by using the keyword search tool below to find specific information within the annual report.-
 1
1 -
2
-
3
-
4
-
5
-
6
-
7
-
8
-
9
-
10
-
11
-
12
-
13
-
14
-
15
-
16
-
17
-
18
-
19
-
20
-
 21
21 -
 22
22 -
 23
23 -
 24
24 -
 25
25 -
 26
26 -
 27
27 -
 28
28 -
 29
29 -
 30
30 -
 31
31 -
 32
32 -
 33
33 -
 34
34 -
 35
35 -
 36
36 -
 37
37 -
 38
38 -
 39
39 -
 40
40 -
 41
41 -
42
-
43
-
44
-
45
-
46
-
47
-
48
-
49
-
50
-
51
-
52
-
53
-
54
-
55
-
56
-
57
-
58
-
59
-
60
-
61
-
62
-
63
-
64
-
65
-
66
-
67
-
68
-
69
-
70
-
71
-
72
-
73
-
74
-
75
-
76
-
77
-
78
-
79
-
80
-
81
-
82
-
83
-
84
-
85
-
86
-
87
-
88
-
89
-
90
-
91
-
92
-
93
-
94
-
95
-
96
-
97
-
98
-
99
-
100
-
101
-
102
-
103
-
104
-
105
-
106
-
107
-
108
-
109
-
110
-
111
-
112
-
113
-
114
-
115
-
116
-
117
-
118
-
119
-
120
-
121
-
122
-
123
-
124
-
125
-
126
 |
 |

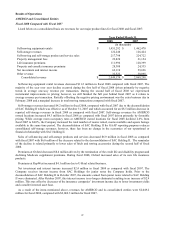
The weighted average common shares outstanding: basic and diluted were 20,838,570 in fiscal 2007 and
20,857,108 in fiscal 2006.
Basic and diluted earnings per share in fiscal 2007 were $3.72, compared with $5.19 in fiscal 2006.
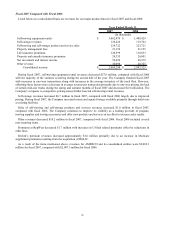
Moving and Storage
Fiscal 2008 Compared with Fiscal 2007
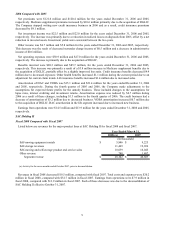
Listed below are revenues for the major product lines at our Moving and Storage Operating Segment for fiscal
2008 and fiscal 2007:
2008 2007
Self-moving equipment rentals $ 1,451,292 $ 1,462,470
Self-storage revenues 110,779 106,498
Self-moving and self-storage product and service sales 207,759 208,677
Property management fees 24,520 23,951
Net investment and interest income 34,906 34,161
Other revenue 28,974 25,994
Moving and Storage revenue $ 1,858,230 $ 1,861,751
(In thousands)
Year Ended March 31,
Self-moving equipment rental revenues decreased $11.2 million in fiscal 2008 compared with fiscal 2007. The
majority of the year over year decline occurred during the first half of fiscal 2008 driven primarily by negative
trends in average one-way revenue per transaction. During the second half of fiscal 2008 we experienced
incremental improvements in pricing; however, we still finished the full year behind fiscal 2007 as it relates to
revenue per transaction. Partially offsetting the negative pricing environment was the extra business day in February
2008 and a marginal increase in total moving transactions compared to fiscal 2007.
Self-storage revenues increased $4.3 million in fiscal 2008 compared with fiscal 2007 primarily due to favorable
pricing. While average room occupancy rates for fiscal 2008 declined 2.6% from fiscal 2007 to 84.0%, the Company
increased the total number of rooms rented, rooms available and square footage available in the same time period.
Sales of self-moving and self-storage products and services decreased $0.9 million in fiscal 2008 as compared
with fiscal 2007 primarily due to lower sales of hitch and towing accessories during the second half of fiscal 2008.
Other revenue increased $3.0 million for fiscal 2008, compared with fiscal 2007. Other revenue includes new
programs that have not yet achieved a significant volume of reportable revenues and other revenues not directly
related to any other reported line item.
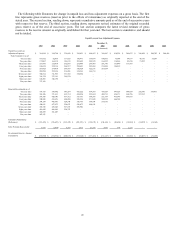
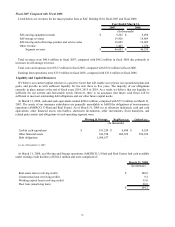
The Company owns and manages self-storage facilities. Self-storage revenues reported in the consolidated
financial statements for Moving and Storage represent Company-owned locations only. Self-storage data for our
owned storage locations was as follows:
2008 2007
Room count as of March 31 131 127
Square footage as of March 31 10,533 10,062
Average number of rooms occupied 109 108
Average occupancy rate based on room count 84.0% 86.6%
Average square footage occupied 8,767 8,653
Year Ended March 31,
(In thousands, except occupancy rate)
26