U-Haul 2008 Annual Report Download - page 113
Download and view the complete annual report
Please find page 113 of the 2008 U-Haul annual report below. You can navigate through the pages in the report by either clicking on the pages listed below, or by using the keyword search tool below to find specific information within the annual report.-
 1
1 -
2
-
3
-
4
-
5
-
6
-
7
-
8
-
9
-
10
-
11
-
12
-
13
-
14
-
15
-
16
-
17
-
18
-
19
-
20
-
21
-
22
-
23
-
24
-
25
-
26
-
27
-
28
-
29
-
30
-
31
-
32
-
33
-
34
-
35
-
36
-
37
-
38
-
39
-
40
-
41
-
42
-
43
-
44
-
45
-
46
-
47
-
48
-
49
-
50
-
51
-
52
-
53
-
54
-
55
-
56
-
57
-
58
-
59
-
60
-
61
-
62
-
63
-
64
-
65
-
66
-
67
-
68
-
69
-
70
-
71
-
72
-
73
-
74
-
75
-
76
-
77
-
78
-
79
-
80
-
81
-
82
-
83
-
84
-
85
-
86
-
87
-
88
-
89
-
90
-
91
-
92
-
93
-
94
-
95
-
96
-
97
-
98
-
99
-
100
-
101
-
102
-
 103
103 -
 104
104 -
 105
105 -
 106
106 -
 107
107 -
 108
108 -
 109
109 -
 110
110 -
 111
111 -
 112
112 -
 113
113 -
 114
114 -
 115
115 -
 116
116 -
 117
117 -
 118
118 -
 119
119 -
 120
120 -
 121
121 -
 122
122 -
 123
123 -
124
-
125
-
126
 |
 |

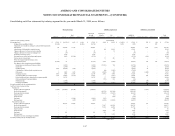
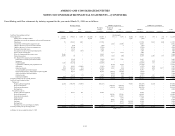
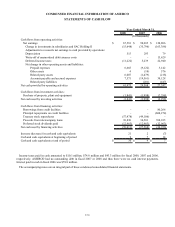
CONDENSED FINANCIAL INFORMATION OF AMERCO
STATEMENTS OF CASH FLOW
2008 2007 2006
Cash flows from operating activities:
Net earnings $ 67,581 $ 90,205 $ 120,806
Change in investments in subsidiaries and SAC Holding II (15,648) (35,796) (163,388)
Adjustments to reconcile net earnings to cash provided by operations:
Depreciation 515 293 79
Write-off of unamortized debt issuance costs - - 13,629
Deferred income taxes (11,222) 5,239 22,940
Net change in other operating assets and liabilities:
Prepaid expenses 6,665 (9,122) 3,142
Other assets 4 (10) 576
Related party assets 6,007 (1,479) (218)
Accounts payable and accrued expenses 7,571 (19,561) 30,128
Related party liabilities - (201) (447)
Net cash provided by operating activities 61,473 29,568 27,247
Cash flows from investment activities:
Purchase of property, plant and equipment (1,841) (1,998) (2,298)
Net cash used by investing activities (1,841) (1,998) (2,298)
Cash flows from financing activities:
Borrowings from credit facilities - - 80,266
Principal repayments on credit facilities - - (860,274)
Treasury stock repurchases (57,478) (49,106) -
Proceeds from intercompany loans 10,830 34,501 768,015
Preferred stock dividends paid (12,963) (12,963) (12,963)
Net cash used by financing activities (59,611) (27,568) (24,956)
Increase (decrease) in cash and cash equivalents 21 2 (7)
Cash and cash equivalents at beginning of period 9 7 14
Cash and cash equivalents at end of period $ 30 $ 9 $ 7
Year Ended March 31,
(In thousands)
Income taxes paid in cash amounted to $10.1 million, $74.8 million and $43.3 million for fiscal 2008, 2007 and 2006,
respectively. AMERCO had no outstanding debt in fiscal 2007 or 2008 and thus there were no cash interest payments.
Interest paid in cash in fiscal 2006 was $59.8 million.
The accompanying notes are an integral part of these condensed consolidated financial statements.
F-56