TomTom 2012 Annual Report Download - page 70
Download and view the complete annual report
Please find page 70 of the 2012 TomTom annual report below. You can navigate through the pages in the report by either clicking on the pages listed below, or by using the keyword search tool below to find specific information within the annual report.-
 1
1 -
2
-
3
-
4
-
5
-
6
-
7
-
8
-
9
-
10
-
11
-
12
-
13
-
14
-
15
-
16
-
17
-
18
-
19
-
20
-
21
-
22
-
23
-
24
-
25
-
26
-
27
-
28
-
29
-
30
-
31
-
32
-
33
-
34
-
35
-
36
-
37
-
38
-
39
-
40
-
41
-
42
-
43
-
44
-
45
-
46
-
47
-
48
-
49
-
50
-
51
-
52
-
53
-
54
-
55
-
56
-
57
-
58
-
59
-
 60
60 -
 61
61 -
 62
62 -
 63
63 -
 64
64 -
 65
65 -
 66
66 -
 67
67 -
 68
68 -
 69
69 -
 70
70 -
 71
71 -
 72
72 -
 73
73 -
 74
74 -
 75
75 -
 76
76 -
 77
77 -
 78
78 -
 79
79 -
 80
80 -
81
-
82
-
83
-
84
 |
 |

TomTom Annual Report and Accounts 2012
68
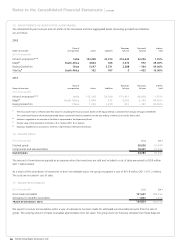
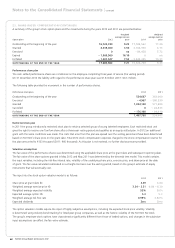
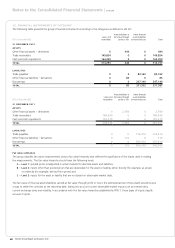
32. FINANCIAL INSTRUMENTS BY CATEGORY
The following table presents the group’s fi nancial instruments according to the categories as defi ned in IAS 39:
(€ in thousands)
Loans and
receivables
Assets/liabilities at
fair value through
profi t or loss
Other fi nancial
assets/liabilities
at amortised cost Total
31 DECEMBER 2012
ASSETS
Other fi nancial assets – derivatives 0 444 0 444
Trade receivables 149,834 0 0 149,834
Cash and cash equivalents 164,459 0 0 164,459
TOTAL 314,293 444 0 314,737
LIABILITIES
Trade payables 0 0 84,162 84,162
Other fi nancial liabilities – derivatives 085085
Borrowings 0 0 247,140 247,140
TOTAL 0 85 331,302 331,387
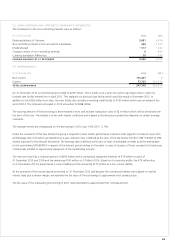
(€ in thousands)
Loans and
receivables
Assets/liabilities at
fair value through
profi t or loss
Other fi nancial
assets/liabilities
at amortised cost Total
31 DECEMBER 2011
ASSETS
Other fi nancial assets – derivatives 0 2,784 0 2,784
Trade receivables 184,939 0 0 184,939
Cash and cash equivalents 193,579 0 0 193,579
TOTAL 378,518 2,784 0 381,302
LIABILITIES
Trade payables 0 0 116,616 116,616
Other fi nancial liabilities – derivatives 0 116 0 116
Borrowings 0 0 383,810 383,810
TOTAL 0 116 500,426 500,542
Fair value estimation
The group classifi es fair value measurements using a fair value hierarchy that refl ects the signifi cance of the inputs used in making
the measurements. The fair value hierarchy should have the following levels:
A – Level 1: quoted prices (unadjusted) in active markets for identical assets and liabilities;
B – Level 2: inputs other than quoted prices that are observable for the asset or liability, either directly (for example, as prices)
or indirectly (for example, derived from prices) and
C – Level 3: inputs for the asset or liability that are not based on observable market data.
The fair value of fi nancial assets/liabilities carried at fair value through profi t or loss is the estimated amount that a bank would receive
or pay to settle the contracts at the reporting date, taking into account current observable market inputs such as interest rates,
current exchange rates and volatility. In accordance with the fair value hierarchy established by IFRS 7, these types of inputs classify
as Level 2 inputs.
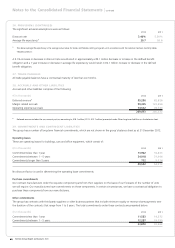
Notes to the Consolidated Financial Statements | continued