TomTom 2012 Annual Report Download - page 52
Download and view the complete annual report
Please find page 52 of the 2012 TomTom annual report below. You can navigate through the pages in the report by either clicking on the pages listed below, or by using the keyword search tool below to find specific information within the annual report.-
 1
1 -
2
-
3
-
4
-
5
-
6
-
7
-
8
-
9
-
10
-
11
-
12
-
13
-
14
-
15
-
16
-
17
-
18
-
19
-
20
-
21
-
22
-
23
-
24
-
25
-
26
-
27
-
28
-
29
-
30
-
31
-
32
-
33
-
34
-
35
-
36
-
37
-
38
-
39
-
40
-
41
-
 42
42 -
 43
43 -
 44
44 -
 45
45 -
 46
46 -
 47
47 -
 48
48 -
 49
49 -
 50
50 -
 51
51 -
 52
52 -
 53
53 -
 54
54 -
 55
55 -
 56
56 -
 57
57 -
 58
58 -
 59
59 -
 60
60 -
 61
61 -
 62
62 -
63
-
64
-
65
-
66
-
67
-
68
-
69
-
70
-
71
-
72
-
73
-
74
-
75
-
76
-
77
-
78
-
79
-
80
-
81
-
82
-
83
-
84
 |
 |

TomTom Annual Report and Accounts 2012
50
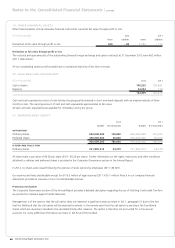
Notes to the Consolidated Financial Statements | continued
5. SEGMENT REPORTING (CONTINUED)
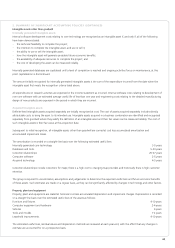
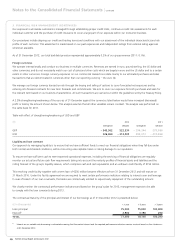
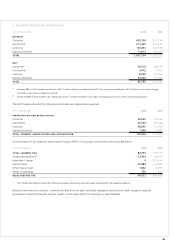
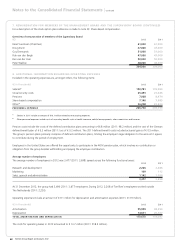
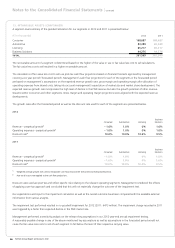
A breakdown of the external revenue to types of products and services and to geographical areas is as follows:
External revenue – products and services
(€ in thousands) 2012 2011
Sale of goods 656,706 866,703
Rendering of services 199,440 191,541
Royalty revenue 200,988 214,973
1,057,134 1,273,217
External revenue – by geographical areas
(€ in thousands) 2012 2011
Europe 772,818 937,483
North America 215,408 256,592
Rest of the world 68,908 79,142
1,057,134 1,273,217
The geographical split of our revenue from the sale of goods and services is based on the location of the customers while the split for
royalty revenue is based on the coverage of our geographical map data and other content.
Total revenue generated in the Netherlands during 2012 amounted to €77 million (2011: €79 million).
The group has no signifi cant concentration of sales from a particular individual external customer.
The non-current assets within TomTom include a signifi cant portion of the carrying value of the step up resulting from Tele Atlas acquisition
in 2008. As this step up is not geographically allocated to the respective regions for internal management reporting, we believe that
disclosure of geographic allocation would be highly judgmental and will not give a true representation of geographical spread of our assets.
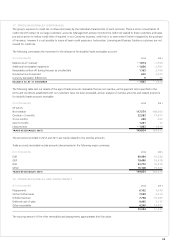
6. COST OF SALES
The group’s cost of sales consists of material costs for goods sold to customers, royalty and license expenses and fulfi lment costs incurred
on inventory sold during the year.
7. REMUNERATION FOR MEMBERS OF THE MANAGEMENT BOARD AND THE SUPERVISORY BOARD
The Remuneration Policy for members of the Management Board is drawn up by the Supervisory Board and approved by the Annual
General Meeting.
In accordance with the Dutch Corporate Governance Code, the remuneration of Supervisory Board members does not depend on the
results of the company. The company does not grant either stock options or shares to its Supervisory Board members and the company
does not provide loans to them.
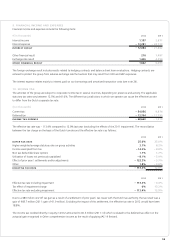
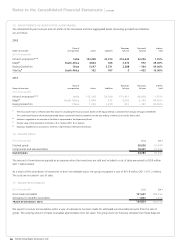
The on-target bonus percentage is set at 64% of the base salary for members of the Management Board and 80% of the salary for the CEO,
and the maximum annual incentive achievable is 96% of the annual base salary for members of the Management Board and for the CEO it
is 120% of the annual base salary. The actual bonus pay-out depends on certain challenging fi nancial targets (revenue, EBIT and cash fl ow).
The total direct remuneration to or on behalf of members of the Management Board for the year ended 31 December 2012, amounted to
approximately €1.8 million (2011: €1.2 million), of which 31% represented bonus payments (2011: 0%). In 2012, the bonus achievement
was 69% of the target bonus (2011: 0%).
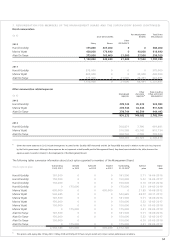
Overview of salaries, performance related bonuses and other emoluments of the Management Board
The remuneration of the Management Board members comprises of the direct remuneration paid out or payable in relation to their
employment in the year and other remuneration related expenses which comprises social security contributions and share based awards.
The expenses recognised for share-based awards are determined in accordance with IFRS 2 and do not represent the amounts paid or
payable to Management Board members. The expenses for the direct remuneration and other remuneration related expenses are presented
on the next page.